What is the impact of alternate water sources and reduction strategies on the site’s total gallons of freshwater consumption?
Project Location: Zone 2A Hot Humid
Simulation Scale: Whole Building
Application: Real Project
Audience: Public/Stakeholder
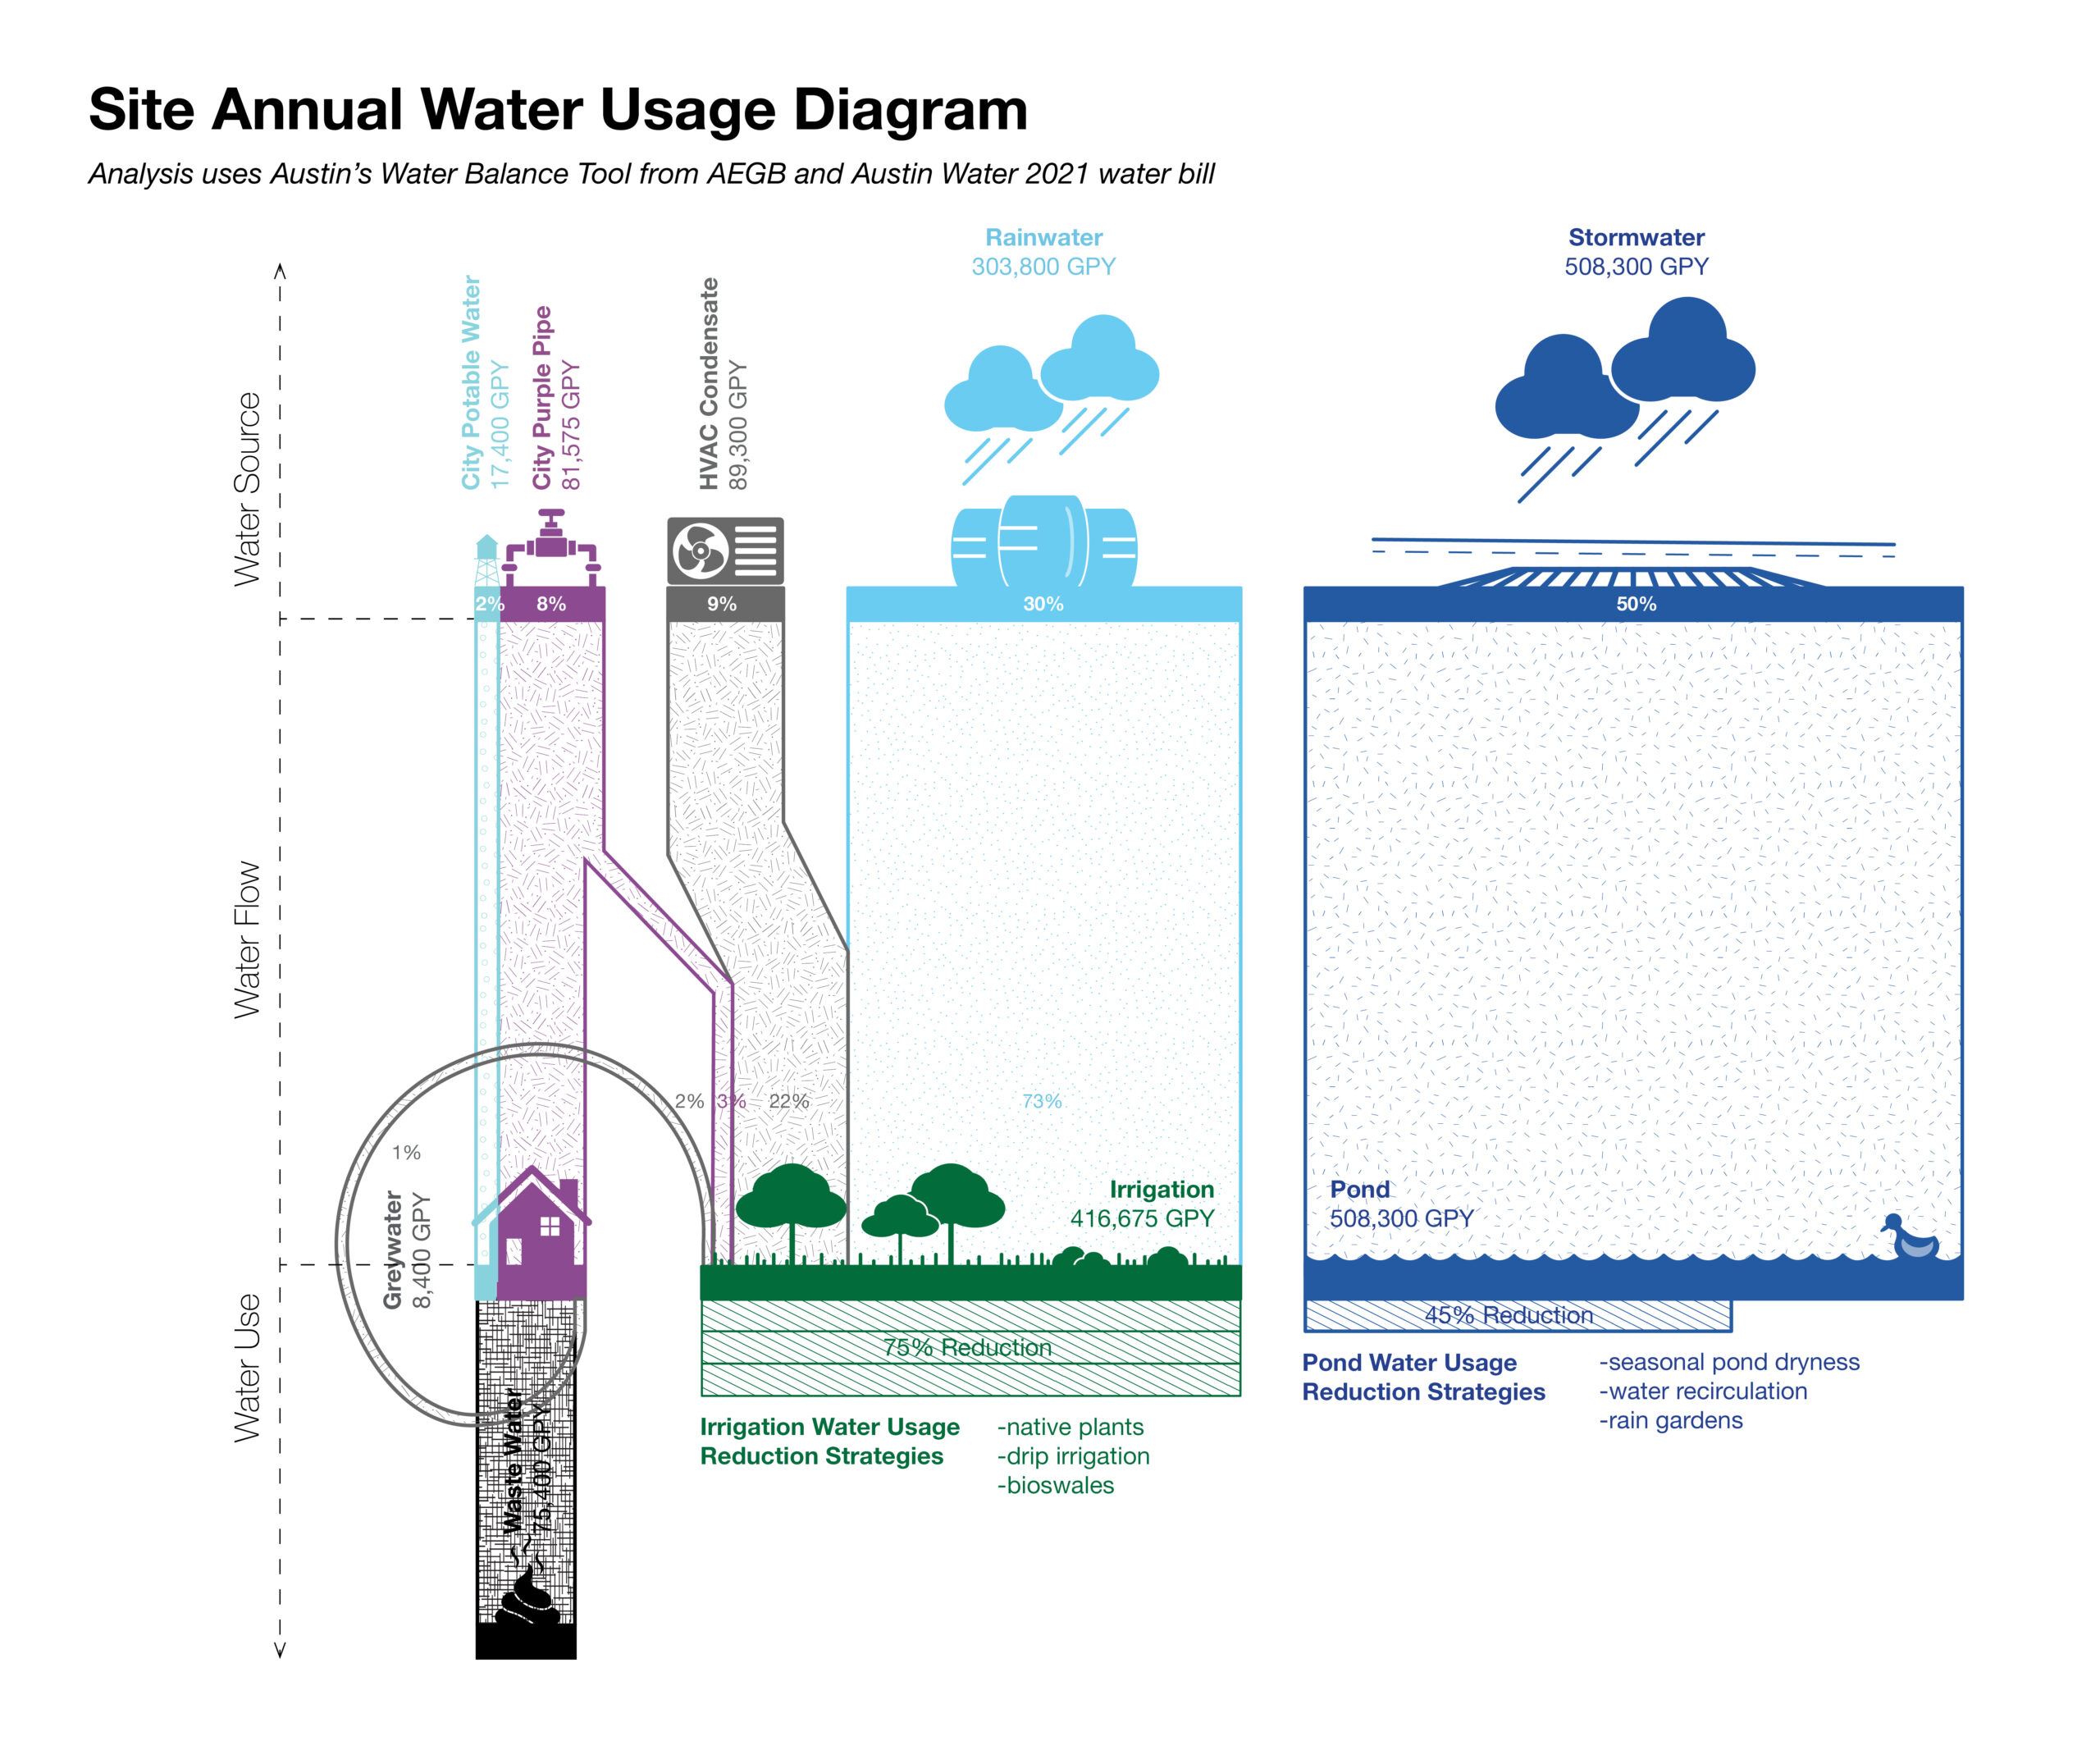
What is this graphic showing? Describe the different parts of the graphic and how it communicates the data.
The graphic shows how water is used on the site during the course of a year. Considering the different water sources and water uses, it breaks down the amount of water flow from each source to the use.
What type of graphic is this?
- Case Study / Multiple
Design Variables
- Other
Is this part of the ASHRAE-209 cycle?
What tools were used for the simulation analysis?
- Other
What tools did you use to create the graphic?
- Adobe Illustrator
- Adobe Indesign
- Excel
- Grasshopper/Rhino
What was successful and/or unique about the graphic in how it communicates information?
The graphic re-organizes water flow information into a Sanke diagram which shows how water flows from sources to uses. It uses percentages to make information easier to grasp. Versions of this graph can be iterated to show how much fresh water will be used on the project site.
Is there anything else you would like to mention?
Additional credits and other contributors:
America Alva, Justin Shultz, Melissa Gutierrez Soto, City of AustinIncluded in the competition:

2024 Annual Project StaSIO Challenge - Deadline 03.30.24
January 18, 2024-November 22, 2024