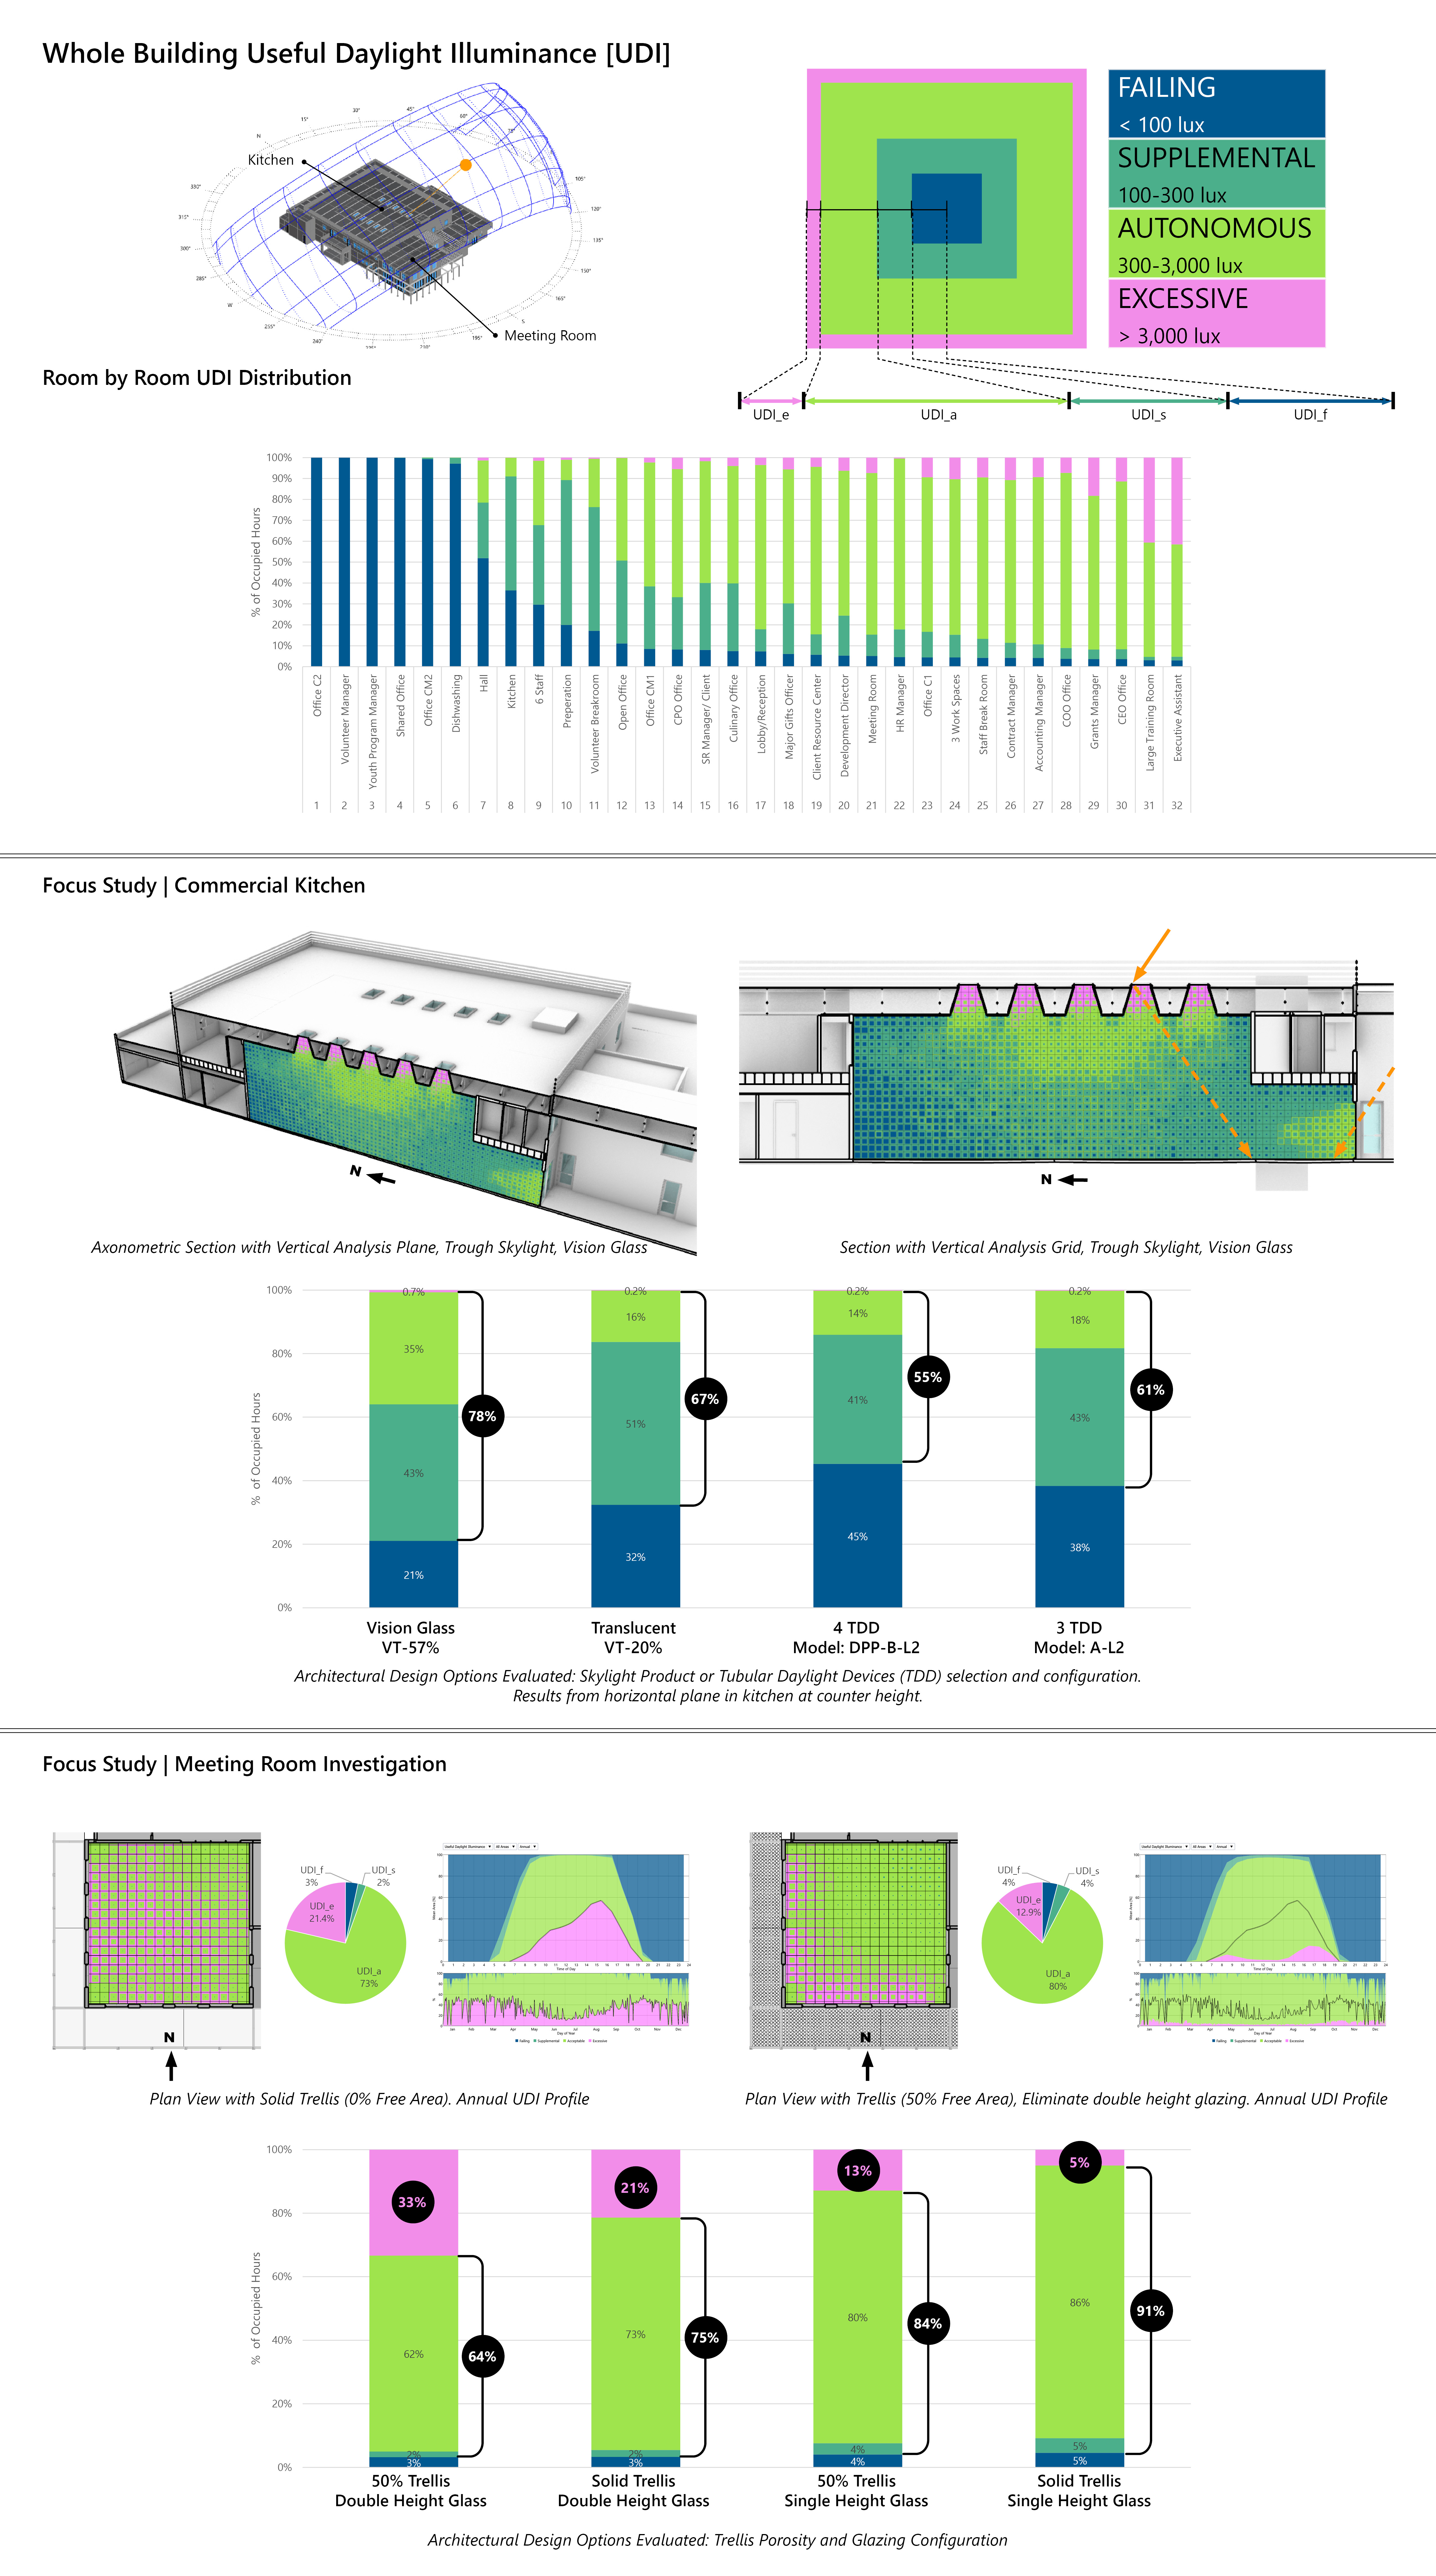
What is the impact of architectural design on useful daylight illuminance??

Project Location: Zone 0A Extremely Hot Humid
Simulation Scale: Floor Plate
Application: Conceptual
Audience: Academic
What is this graphic showing? Describe the different parts of the graphic and how it communicates the data.
This graphic shows the UDI performance for the regularly occupied zones of the building along with focused analysis to bring daylight into the commercial kitchen located in the core with no exterior walls and the over lit meeting room.
What type of graphic is this?
- Analysis grid
- Case Study / Multiple
- Other
- Table / Chart
Design Variables
- Building Massing
- Building Materials
- Glazing Fraction/Window to Wall ratio
Is this part of the ASHRAE-209 cycle?
What tools were used for the simulation analysis?
- Climate Studio
- Excel
- Other
What tools did you use to create the graphic?
- Adobe Indesign
- Excel
- Grasshopper/Rhino
What was successful and/or unique about the graphic in how it communicates information?
The room by room visualization is a fresh way to compare side by side data for daylight results. It offers a great way to easily dial in on spaces without adequate daylight and those that are well daylit or over daylit to iterate design options to improve performance. The kitchen's vertical analysis plane tells the story of how bringing daylight from above helps enhance the space overall.
Is there anything else you would like to mention?
The analysis was performed with ClimateStudio
Included in the competition:
2024 Annual Project StaSIO Challenge - Deadline 03.30.24
January 18, 2024-November 22, 2024

