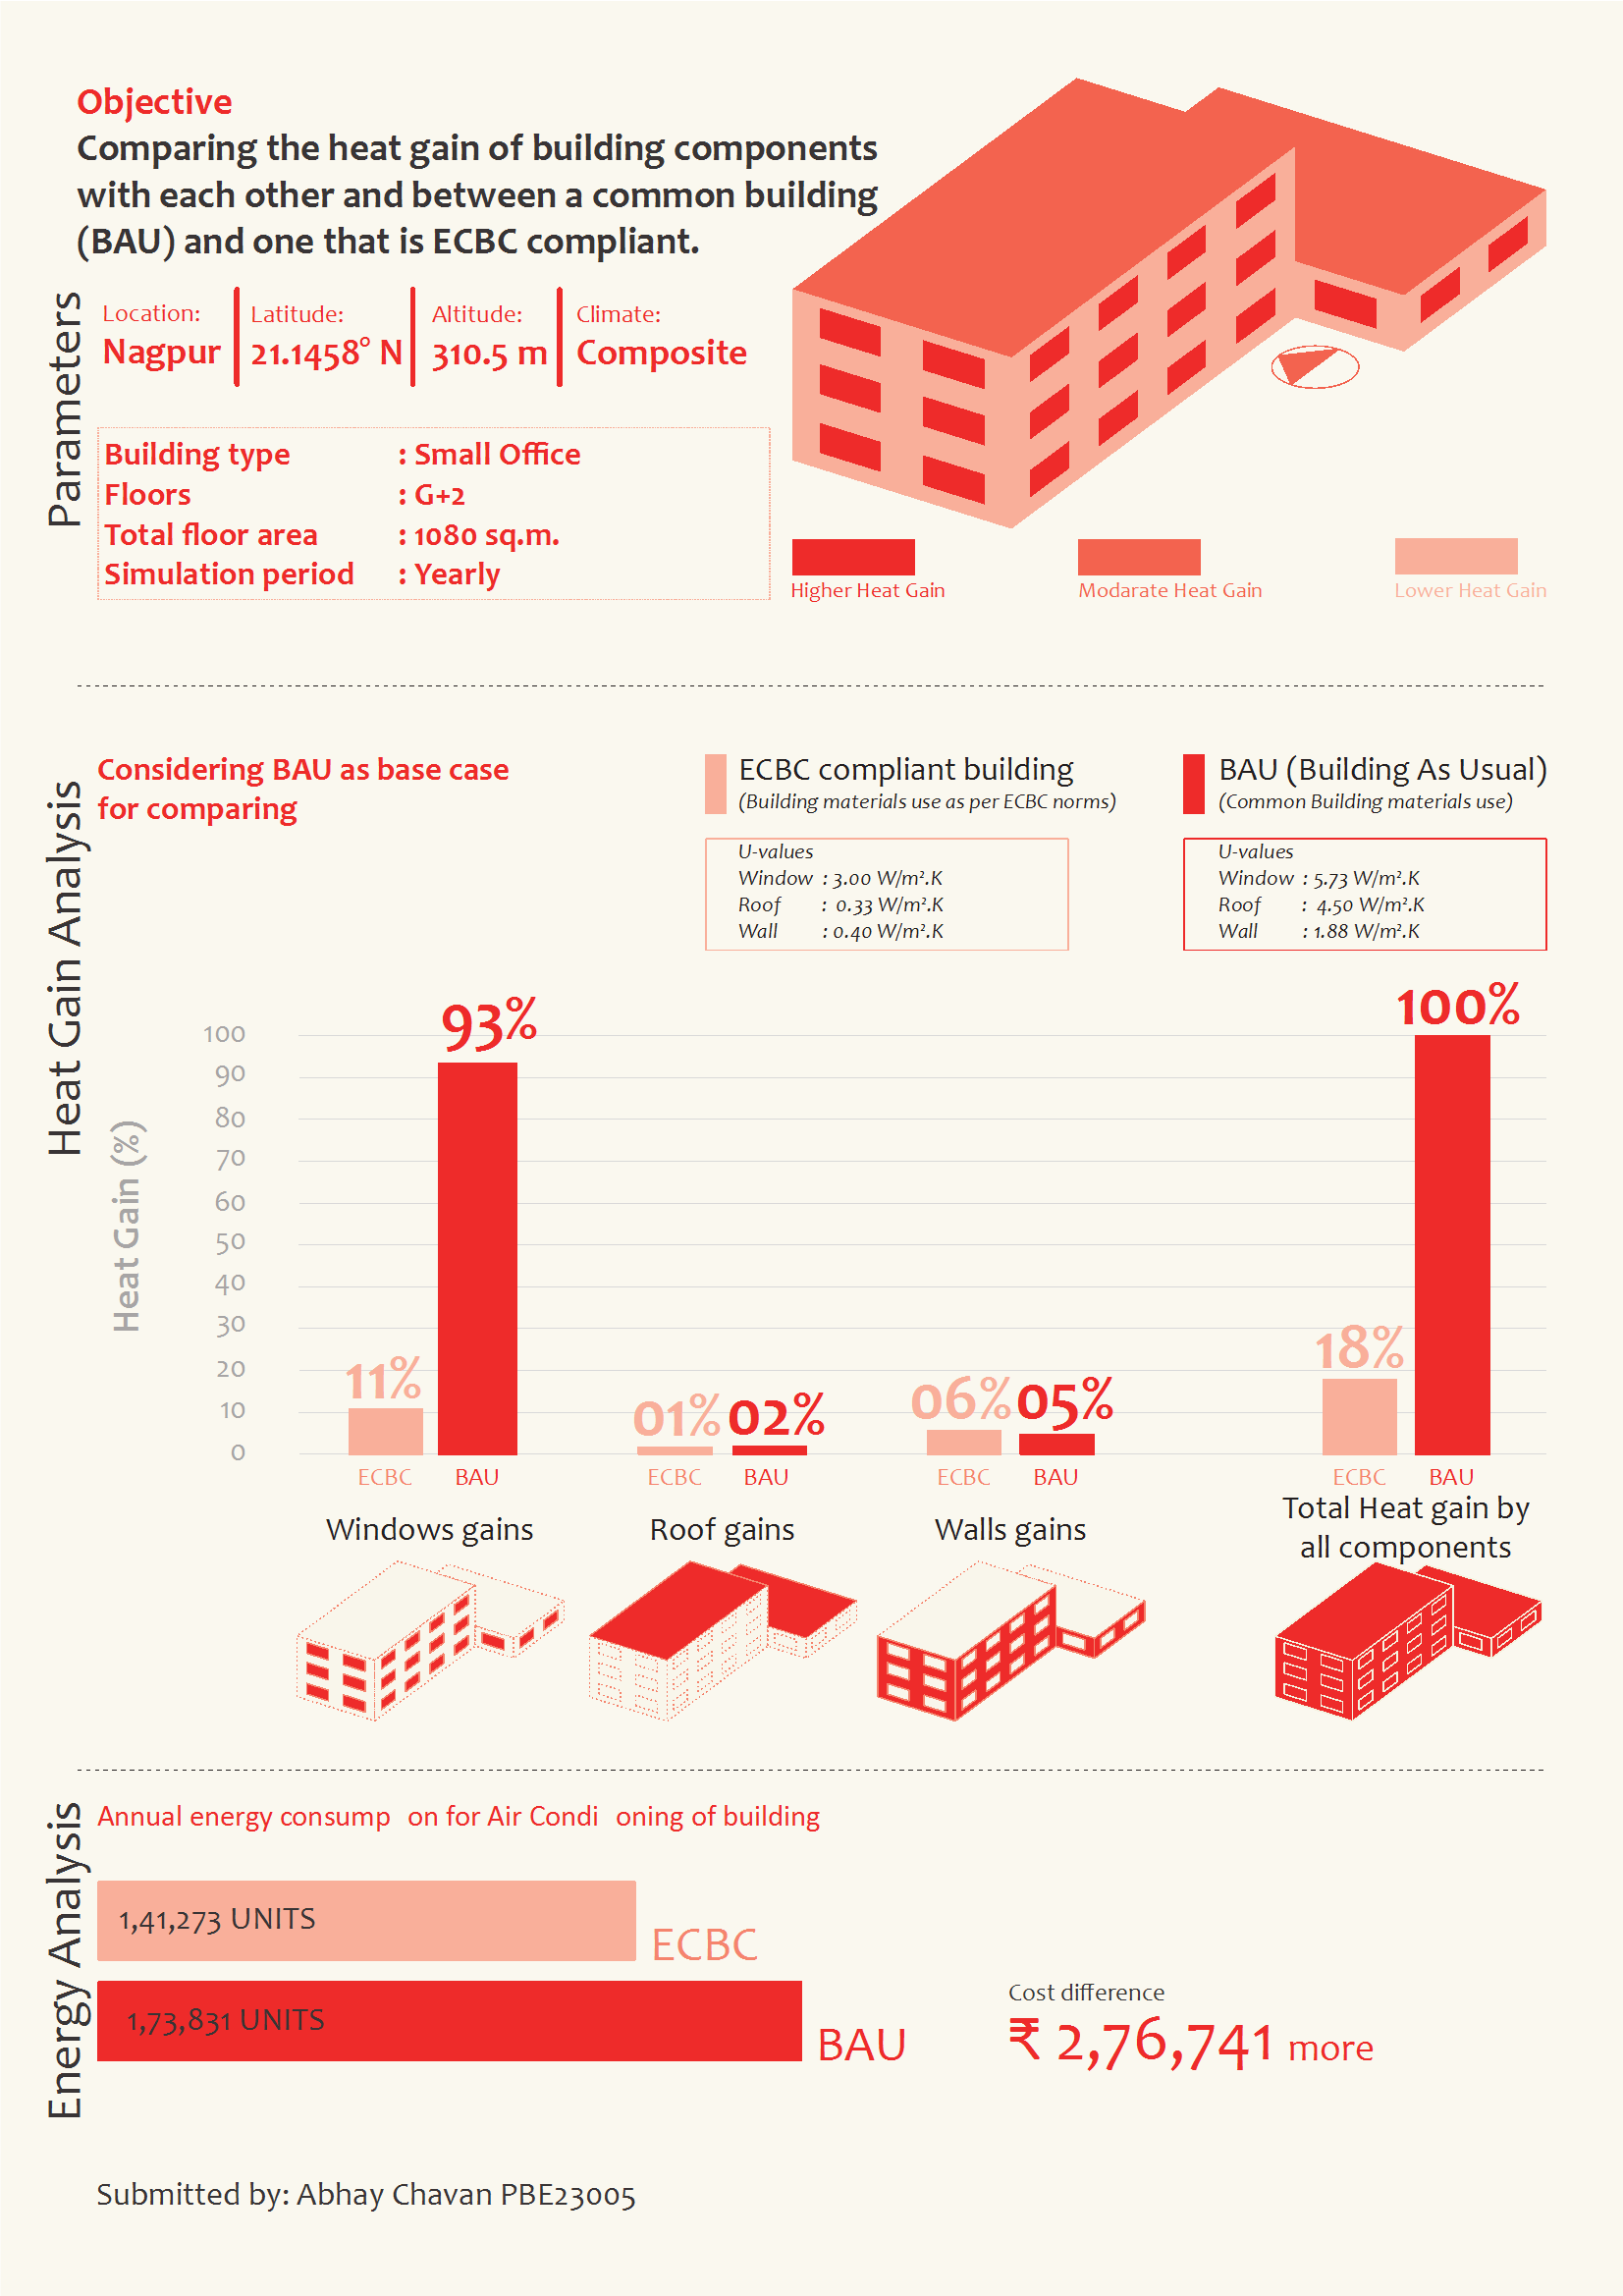
What is the impact of building components on heat gain?

Project Location: Aw
Simulation Scale: Shoebox Model
Application: Conceptual
Audience: Architect/Designer
What is this graphic showing? Describe the different parts of the graphic and how it communicates the data.
The infographic displayed above shows the amount of heat gained by the building components, such as windows, roofs, and walls. Additionally, it compares a standard building with an ECBC-compliant one, which further highlights the impact of changes made in the following ways: • It highlights how different materials and construction methods reduce the heat gain capacity. • Energy consumption for space Air Conditioning. • Cost differentiation.
What type of graphic is this?
- Diagram
- Analysis grid
Design Variables
- Building Materials
- Glass U-value / SHGC
What tools were used for the simulation analysis?
- Design Builder
- EnergyPlus
- Excel
What tools did you use to create the graphic?
- Adobe Photoshop
- Excel
What was successful and/or unique about the graphic in how it communicates information?
• Colours used to differentiate different intensities. • Graphics used to show different components of the building. • Data are shown in % to easily compare with other.
Is there anything else you would like to mention?
1. What are the primary inputs of the analysis? • ECBC-compliant building components (U-Values of window, roof, and wall). • Building with standard construction practice (U-Values of window, roof, and wall). 2. What are the primary outputs of the analysis? • Heat gains through windows, roofs, and walls. • Annual energy consumption.
Included in the competition:
2024 Annual Project StaSIO Challenge - Deadline 03.30.24
January 18, 2024-November 22, 2024

