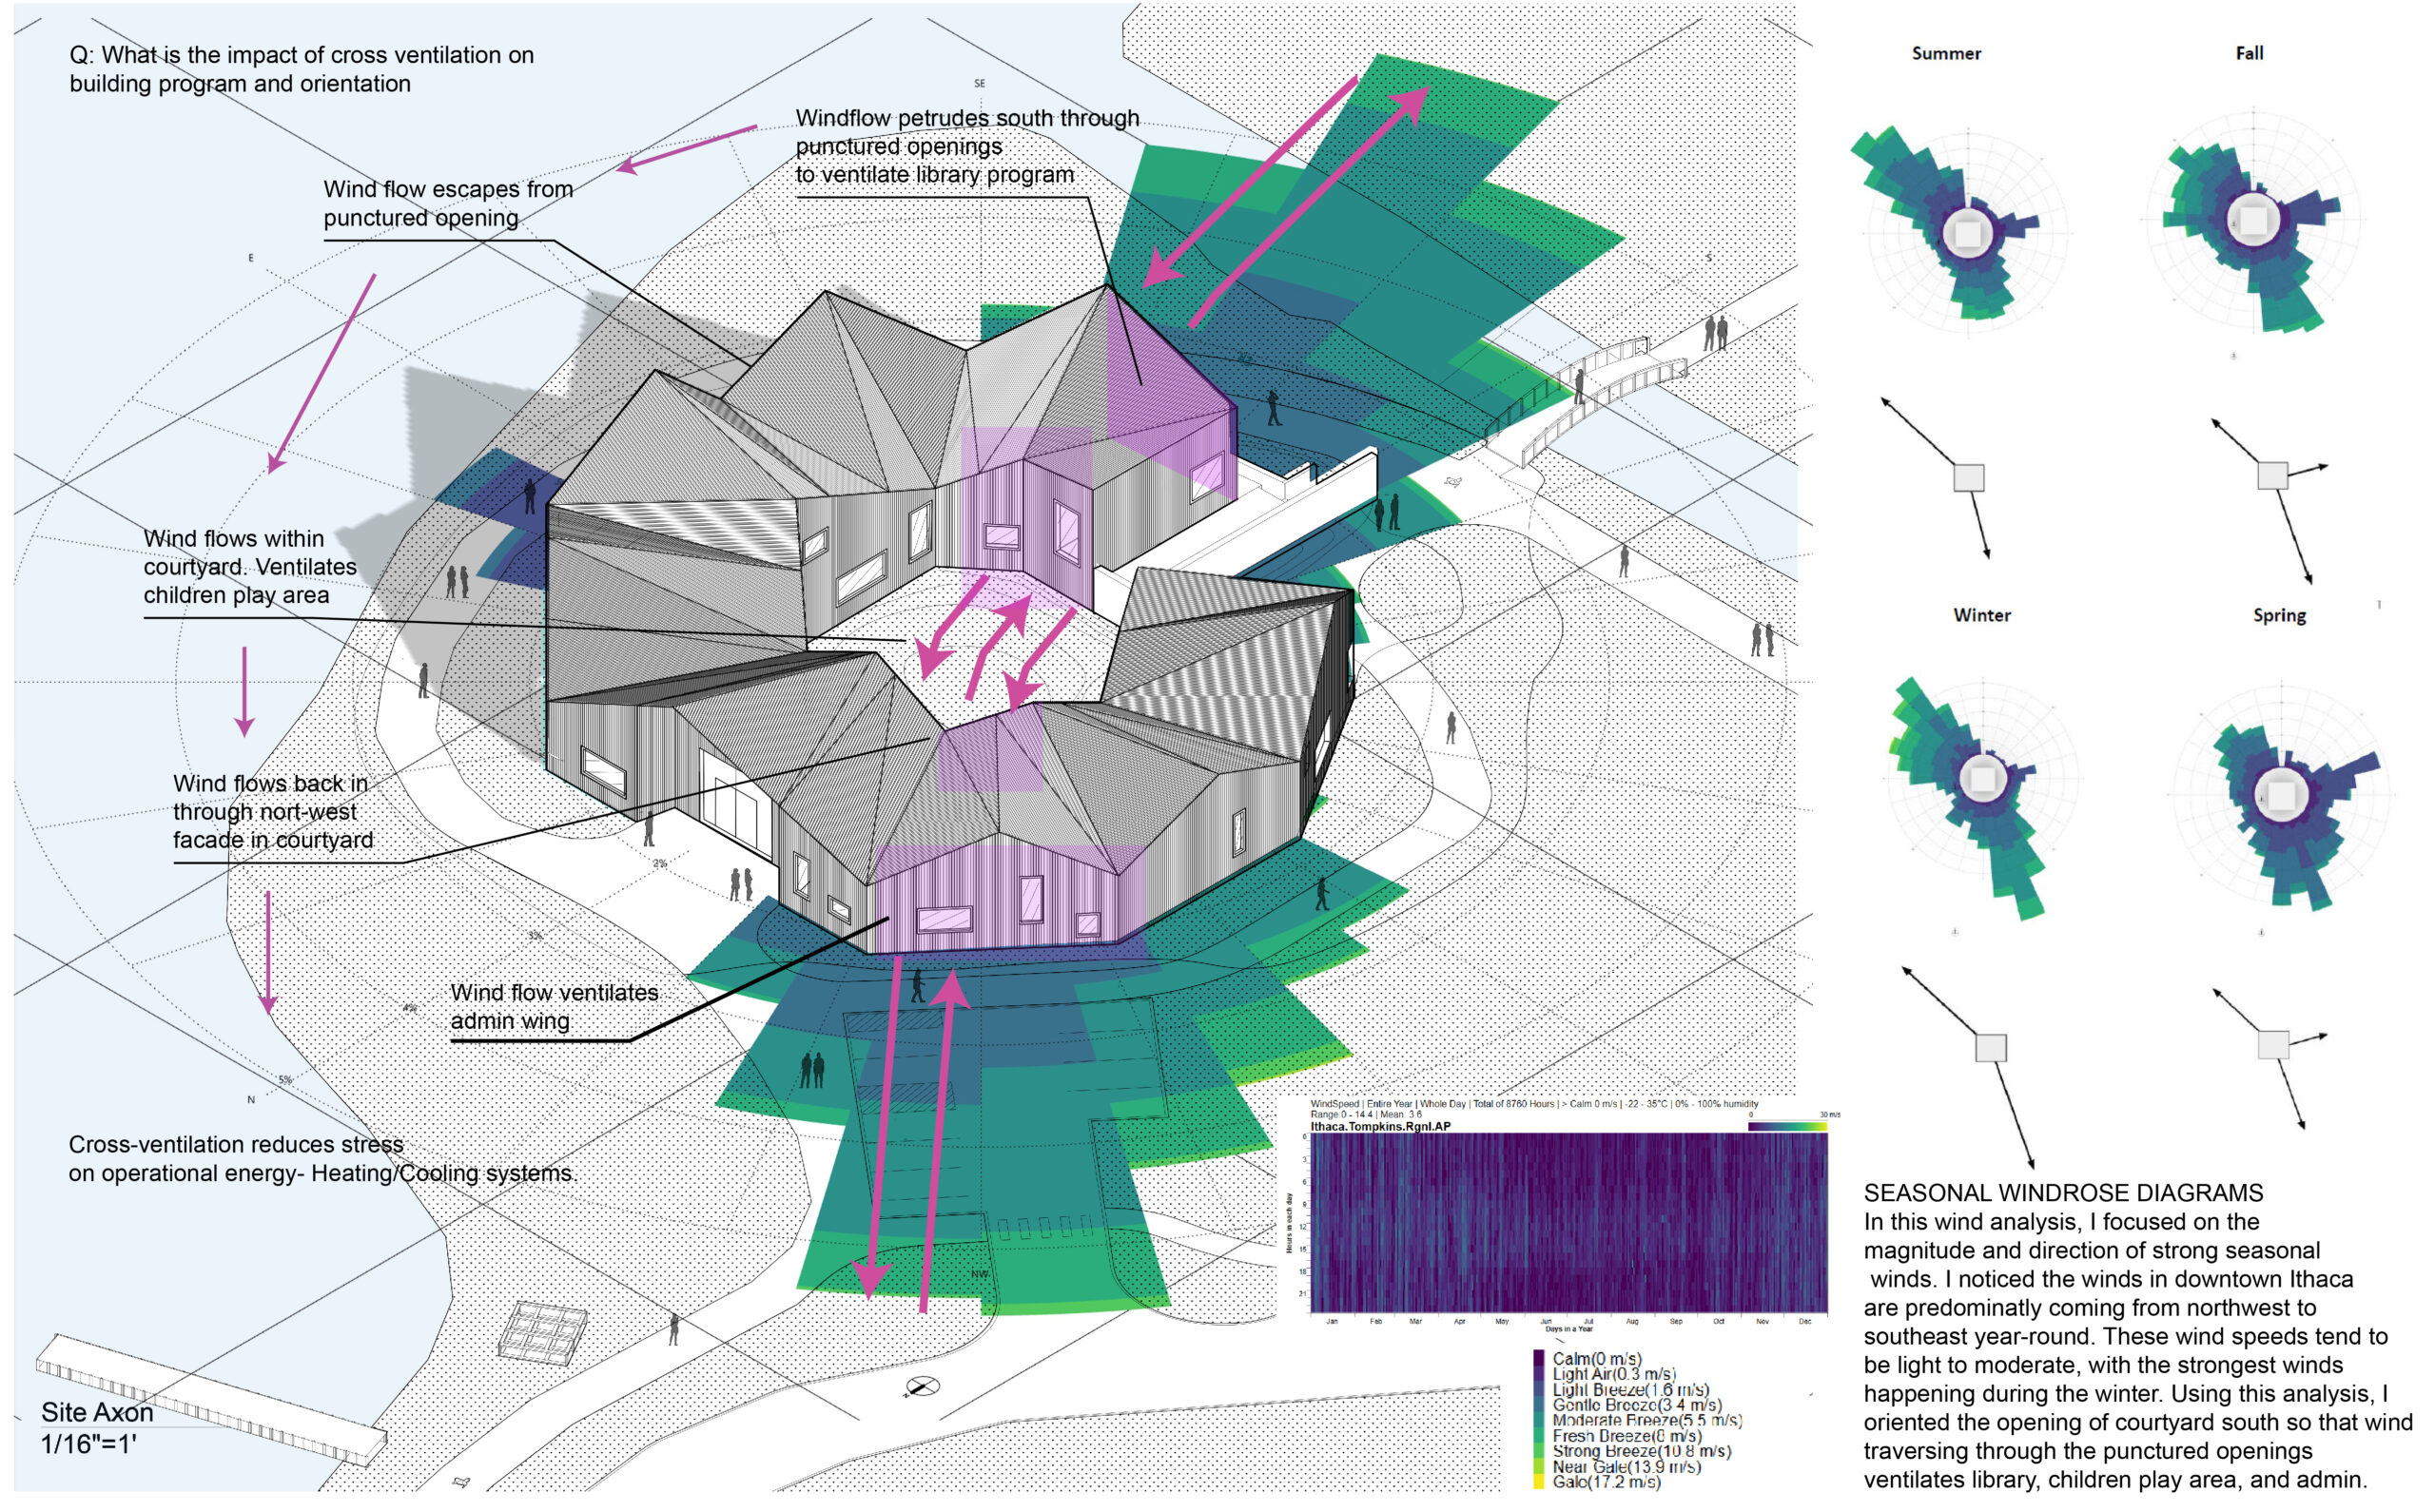
What is the impact of cross ventilation on building program and orientation?

Project Location:
Simulation Scale:
Application:
Audience:
What is this graphic showing? Describe the different parts of the graphic and how it communicates the data.
The graphic is showing an overlay of my site axonometric of my studio design with wind flow analysis to communicate how the placement of program and orientation was justified through cross ventilation. The purple arrows indicate the directions of southeast and northwest air movements observed by the windrose diagrams across different seasons. The purple areas represent critical moments of punctured openings in the facade, which enable cross ventilation. I also include descriptions that indicate which program areas are being cross ventilated.
What type of graphic is this?
- Diagram
Design Variables
- Building Massing
- Window shading/sun control
Is this part of the ASHRAE-209 cycle?
- Cycle 2 Conceptual Design
- Cycle 5 Design Refinement
What tools were used for the simulation analysis?
- Other
What tools did you use to create the graphic?
- Adobe Illustrator
- Adobe Indesign
- Adobe Photoshop
- Grasshopper/Rhino
What was successful and/or unique about the graphic in how it communicates information?
A strength of my submissions is that it overlays wind flow analysis diagrams with the axonometric site drawing for my library studio project. Combining architectural graphic with environmental analysis functions well as a technique to visually represent passive design strategies to clients.
Is there anything else you would like to mention?
Included in the competition:
2023 Annual StaSIO Challenge
March 21, 2023-June 12, 2023

