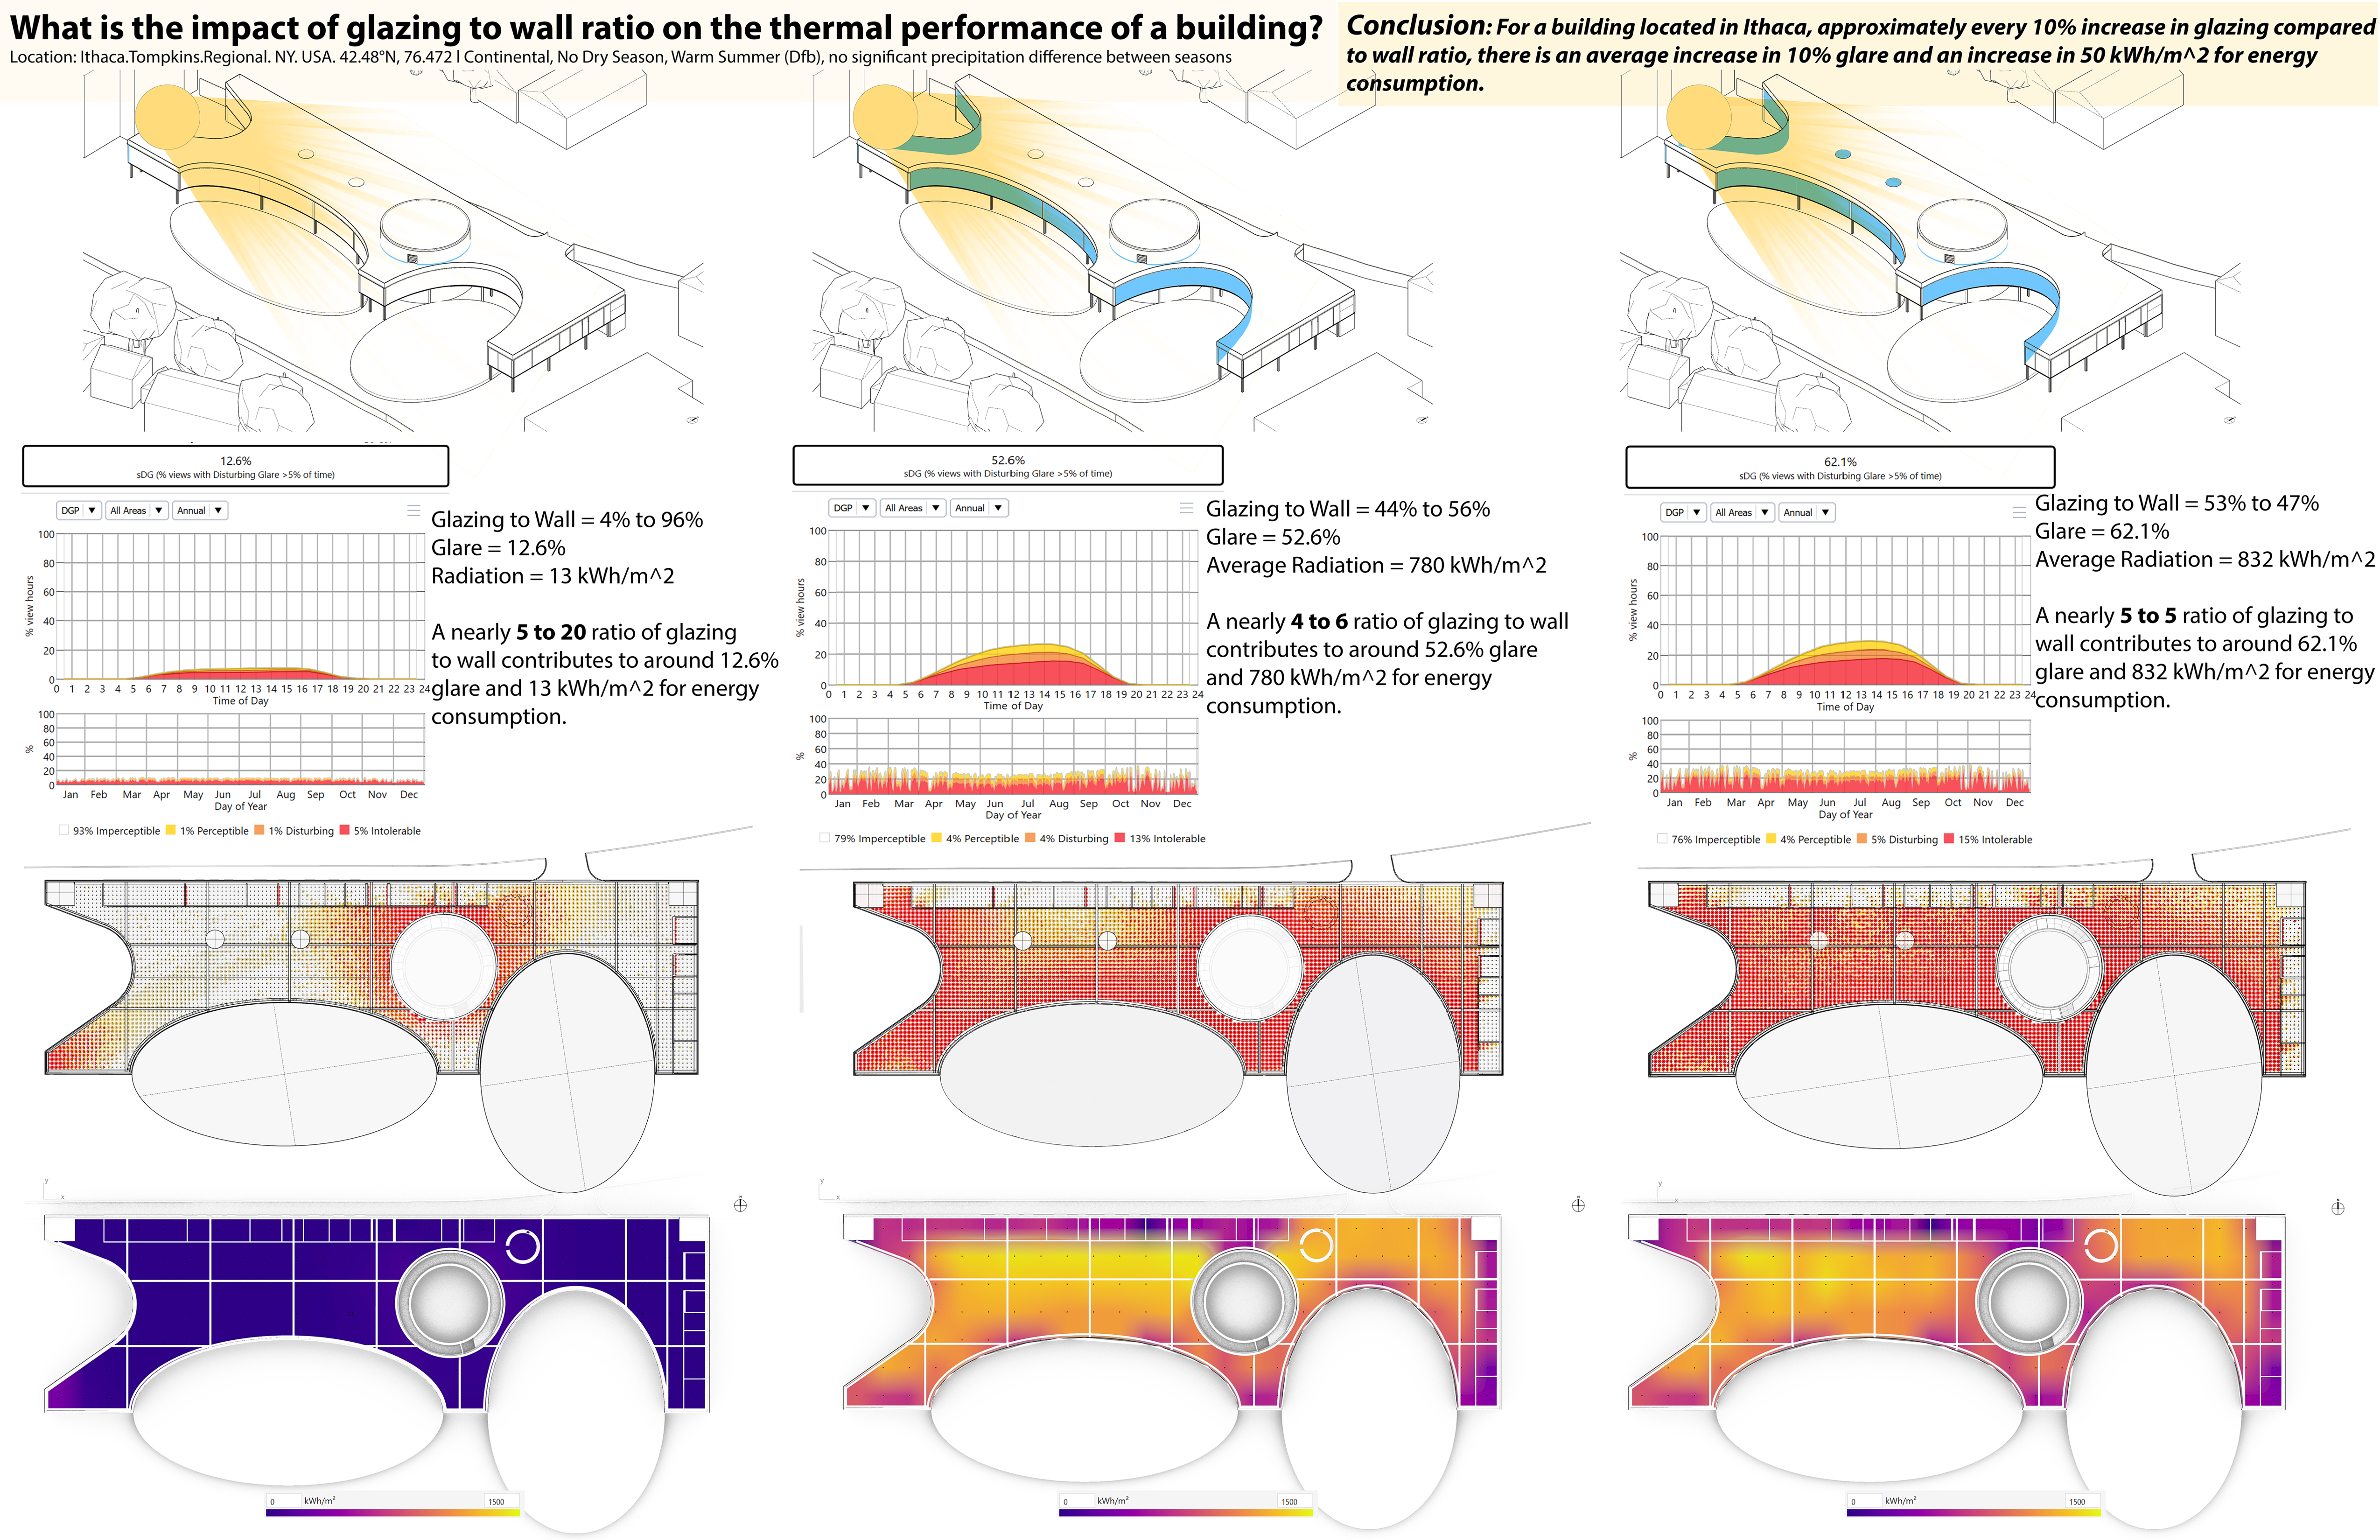
What is the impact of glazing to wall ratio on thermal performance?

Project Location:
Simulation Scale:
Application:
Audience:
What is this graphic showing? Describe the different parts of the graphic and how it communicates the data.
The first row shows the glazing's location and the sun's direction on the building. The second row indicates a chart that describes the third row's glare distribution. The fourth row shows the radiation map of the building. Each column indicates a subsequent increase in glazing.
What type of graphic is this?
- Diagram
Design Variables
- Glazing Fraction/Window to Wall ratio
Is this part of the ASHRAE-209 cycle?
- Cycle 6 Design Integration + Optimization
- Prerequisites
What tools were used for the simulation analysis?
- Other
What tools did you use to create the graphic?
- Adobe Photoshop
- Grasshopper/Rhino
- PowerPoint
What was successful and/or unique about the graphic in how it communicates information?
It's a clear step-by-step process of how an increase in glazing contributes to greater glare and energy consumption.
Is there anything else you would like to mention?
I am a student.
Included in the competition:
2023 Annual StaSIO Challenge
March 21, 2023-June 12, 2023

