What is the impact of Heating and Cooling load on several facade designs?

Project Location:
Simulation Scale:
Application:
Audience:
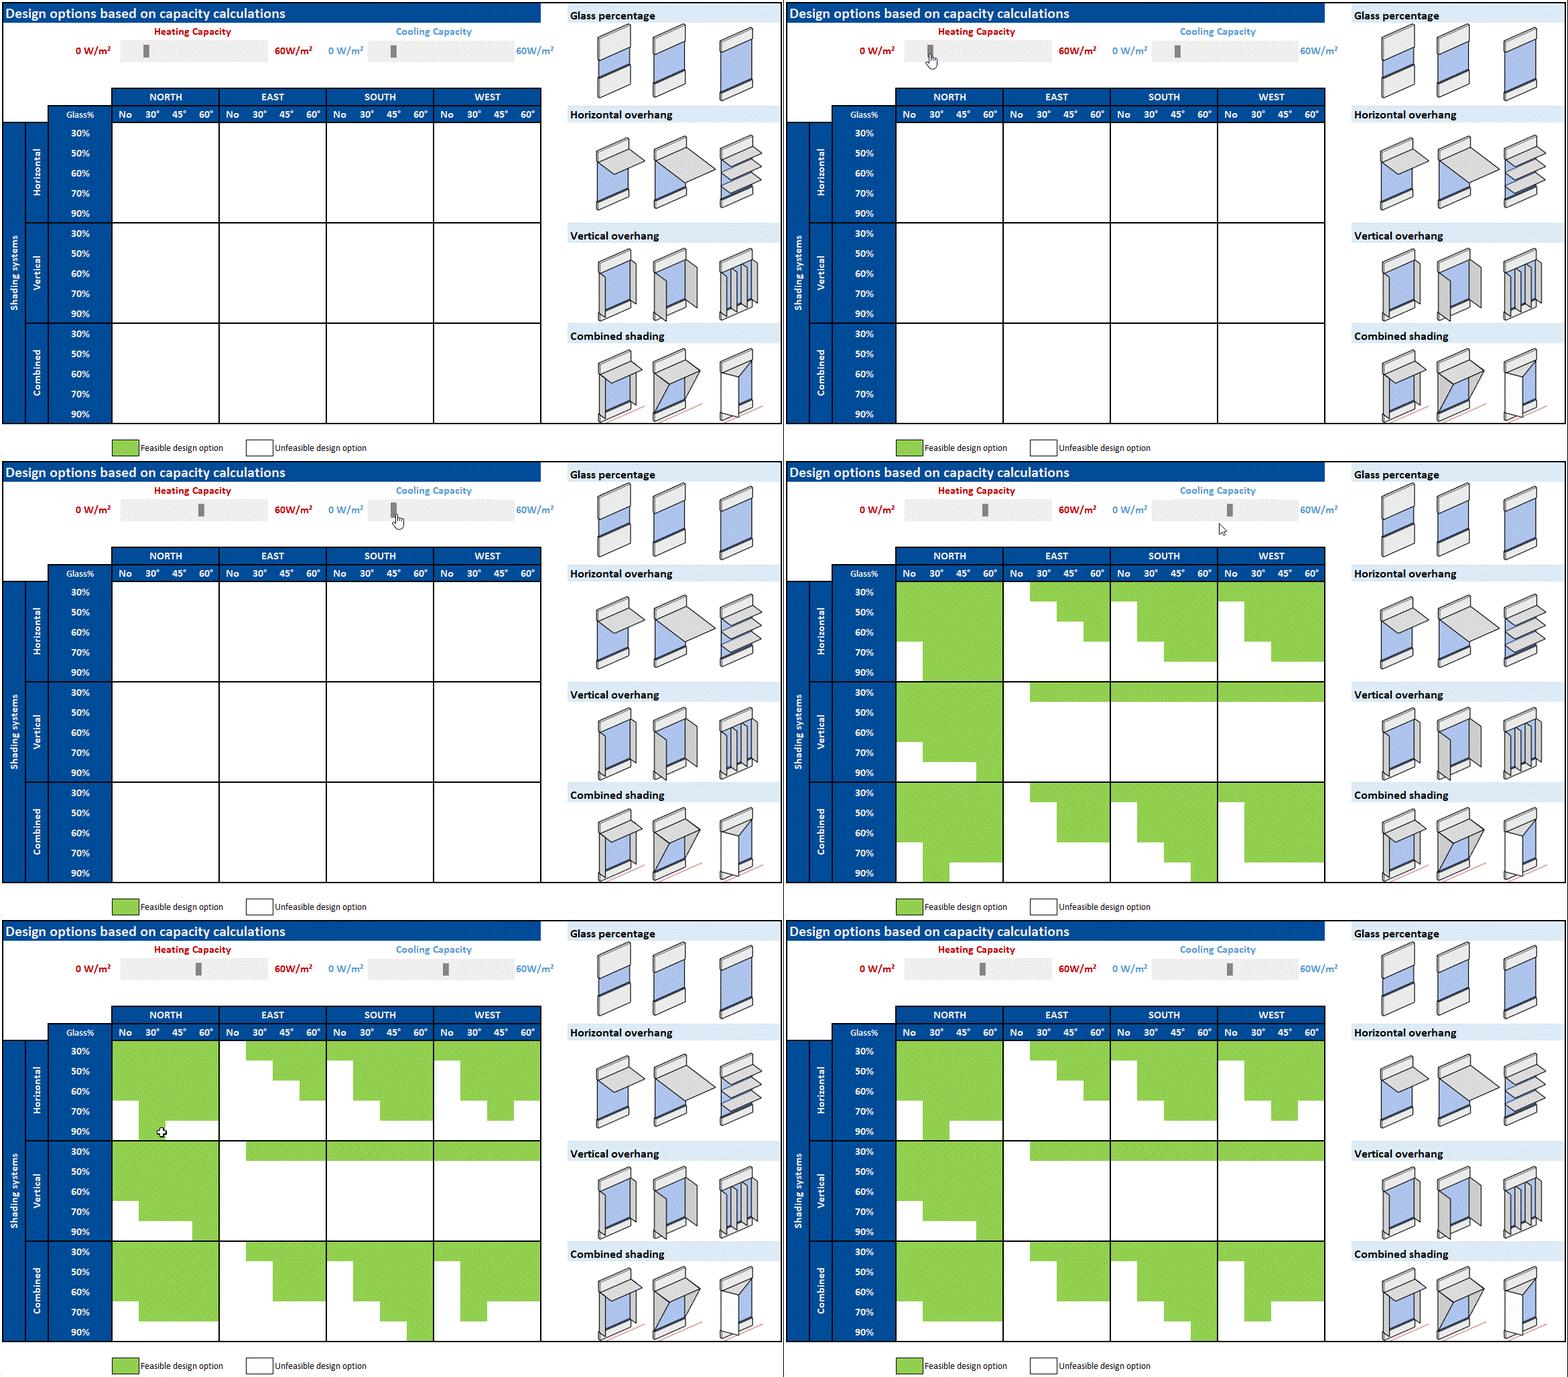
What is this graphic showing? Describe the different parts of the graphic and how it communicates the data.
The matrix shows the possible facade designs under a specific heating or cooling demand. The variables are different orientations (North, South, East, West) with varying glass percentages (30%,50%,60%,70%,90%), shading types (Horizontal, Vertical, Combined) and angles (No (0°), 30°,45°,60°). Possible facade models are shown on the right side of the matrix. The slider on the top for heating and cooling capacity can be altered to see the several design options the designer can choose from in incoordination with the chosen energy concepts during the sketch design.
What type of graphic is this?
- Animated gif
- Table / Chart
Design Variables
- Glass U-value / SHGC
- Glazing Fraction/Window to Wall ratio
- Window shading/sun control
What tools were used for the simulation analysis?
- Design Builder
- EnergyPlus
What tools did you use to create the graphic?
- Excel
What was successful and/or unique about the graphic in how it communicates information?
The design options were chosen by the architect and the maximum peak load was chosen by the HVAC engineers. So, during the design and for further discussions architects had a handful of design options to explore and to treat different facades in relation to the solar gains and loads. This approach enabled designs to comply with the set energy and sustainability benchmark.
Is there anything else you would like to mention?
Additional credits and other contributors:
Traject Advisors and Managers, The NetherlandsIncluded in the competition:
2023 Annual StaSIO Challenge
March 21, 2023-June 12, 2023

