What is the impact of massing on solar PV output and module layout?
Project Location:
Simulation Scale:
Application:
Audience:
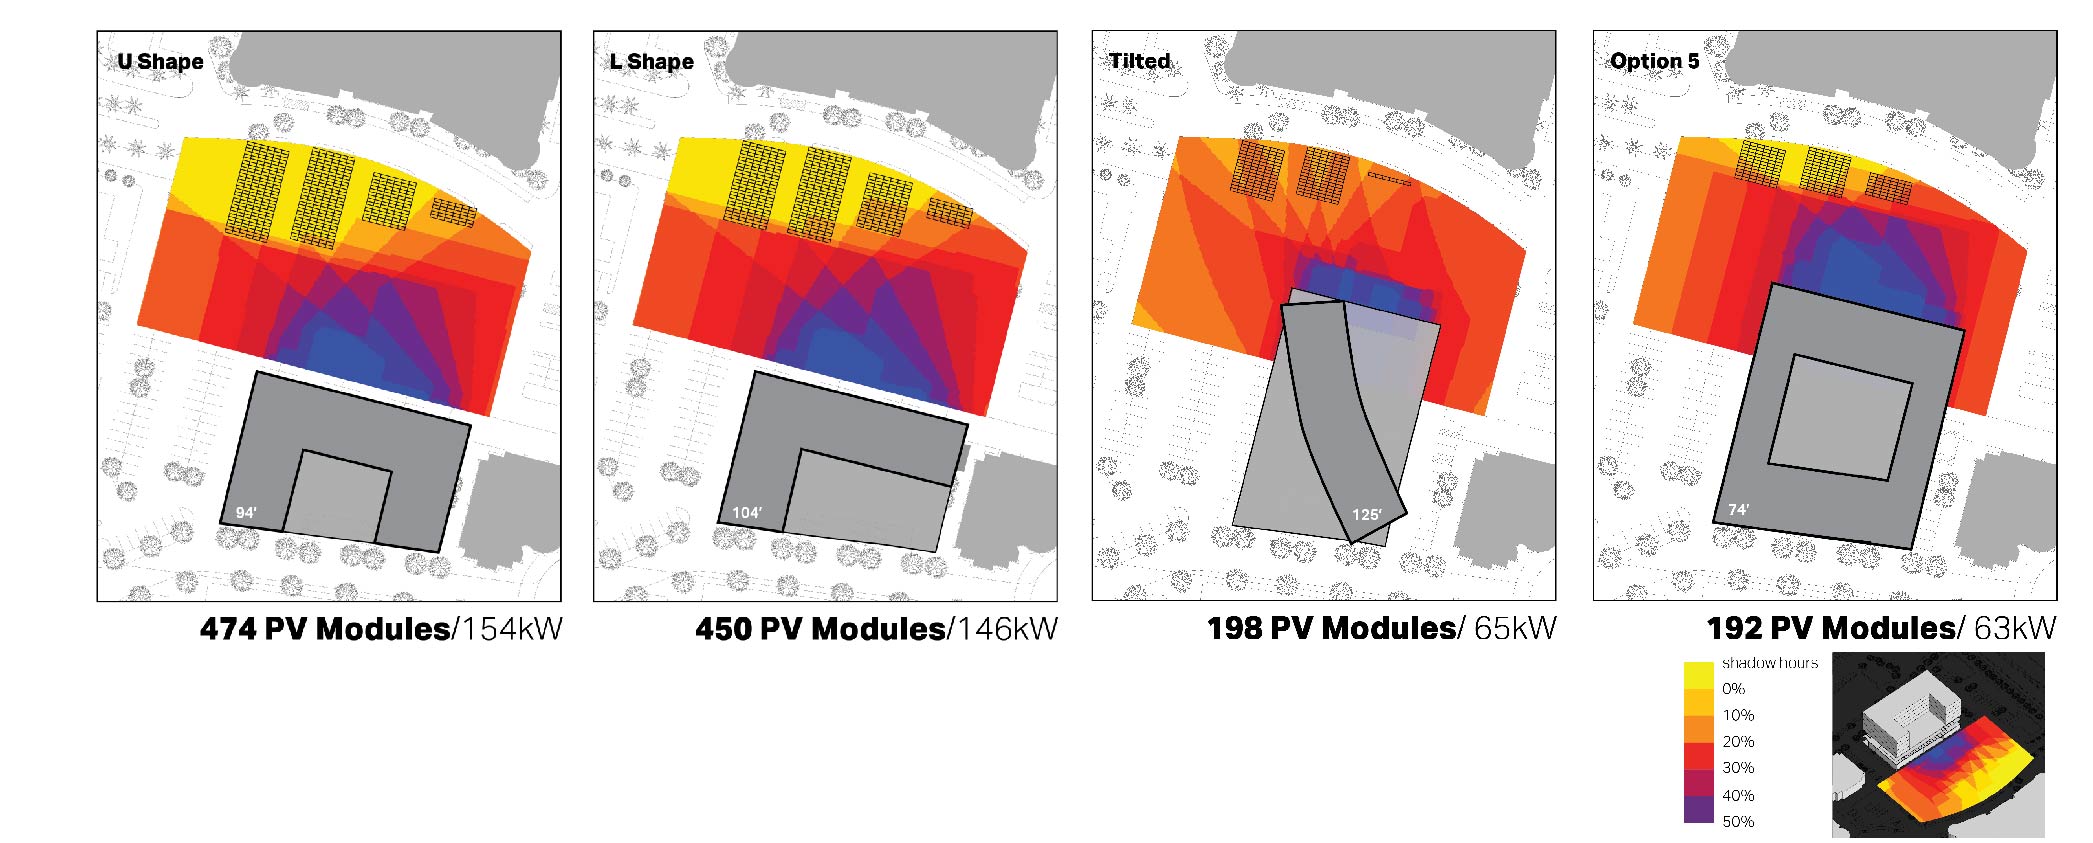
What is this graphic showing? Describe the different parts of the graphic and how it communicates the data.
The graphic shows comparison of four massing options and the projected average sunlight hours map onto the northern part of the site. The study aims to assess the impacts of the fours selected massing strategies on the Solar PV array size, output and array layout. The bottom half shows the analysis area in 3D in relation to the building, as well as the remapped legend. The heat map outlines are also exported to AutoCAD and converted to zones to assist in the PV design and planning process by the PV consultant.
Is this part of the ASHRAE-209 cycle?
- Cycle 1 Simple Box Model
What tools were used for the simulation analysis?
- Ladybug Tools
What tools did you use to create the graphic?
- Adobe Illustrator
- Grasshopper/Rhino
What was successful and/or unique about the graphic in how it communicates information?
The layout and consistent values upfront makes it easier to compare. The 3D information provides additional context, as well as the height information adds a secondary layer of viewpoint.
Is there anything else you would like to mention?
This is intended to be an early stage quick analysis to support the Architects to make design decision.
Included in the competition:

Solar Shading and Building Performance
January 7, 2021-February 8, 2021