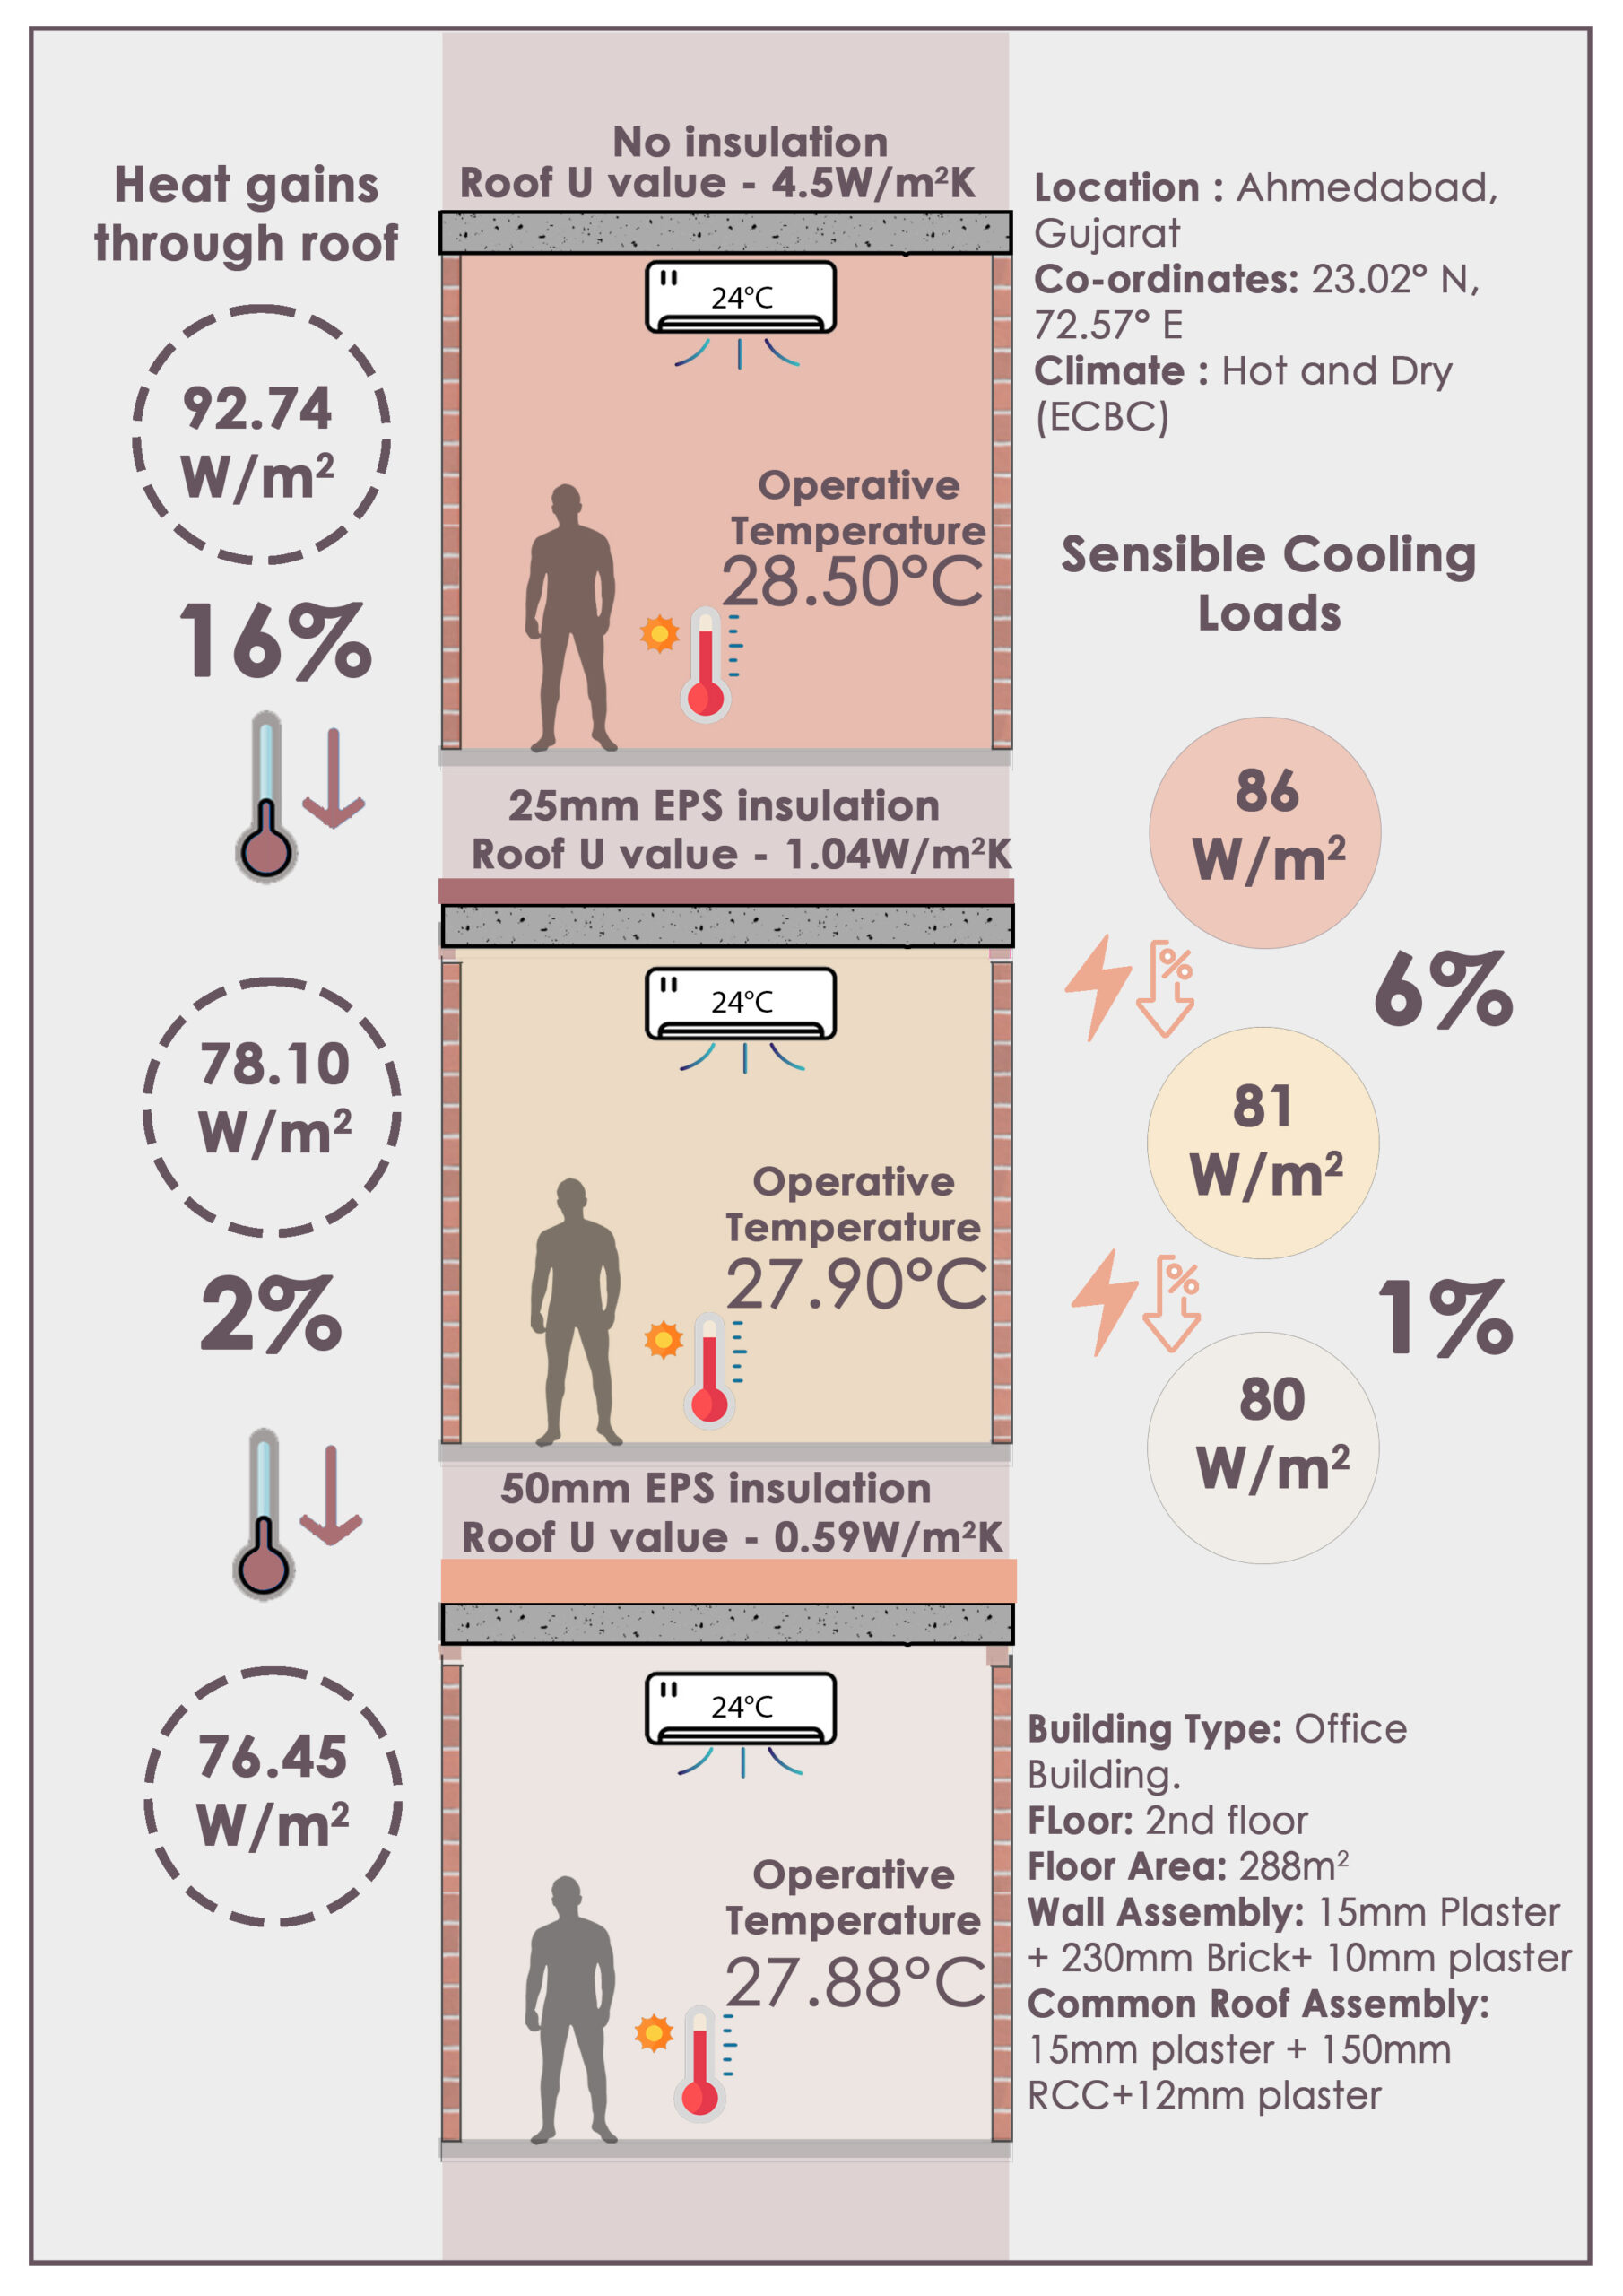
What is the impact of Roof Insulation on Indoor Operative temperature, corresponding heat gains and cooling loads.?

Project Location: Zone 0A Extremely Hot Humid
Simulation Scale: Floor Plate
Application: Conceptual
Audience: Academic
What is this graphic showing? Describe the different parts of the graphic and how it communicates the data.
The graphic illustrates the impact of ideal roof insulation on the indoor operative temperature (°C), heat gains (W/m^2) , and cooling loads (W/m^2) of an office building situated in Ahmedabad, known for its hot and dry climate. It demonstrates how the indoor operative temperature decreases, along with a reduction in heat gains and cooling loads, as roof insulation is added. The base case study represents the scenario without any insulation.
What type of graphic is this?
- Case Study / Multiple
- Diagram
Design Variables
- Insulation R-value
Is this part of the ASHRAE-209 cycle?
What tools were used for the simulation analysis?
- Design Builder
- EnergyPlus
What tools did you use to create the graphic?
- Adobe Photoshop
What was successful and/or unique about the graphic in how it communicates information?
The illustration presents the indoor operative temperature perceived by occupants. It depicts the percentage reduction in corresponding heat gains and cooling loads. In the base case, represented by darker colors indoors, the temperature is higher, while the colors gradually lighten as insulation is added, signifying reduced temperature and cooling loads.
Is there anything else you would like to mention?
It can be inferred that in the preceding scenario, 25 mm insulation is optimal, as increasing the insulation to 50 mm does not yield a significant impact compared to the 25 mm case.
Included in the competition:
2024 Annual Project StaSIO Challenge - Deadline 03.30.24
January 18, 2024-November 22, 2024

