What is the impact of schematic and developed design variables on energy consumption, visual and thermal comfort?
Project Location:
Simulation Scale:
Application:
Audience:
What is this graphic showing? Describe the different parts of the graphic and how it communicates the data.
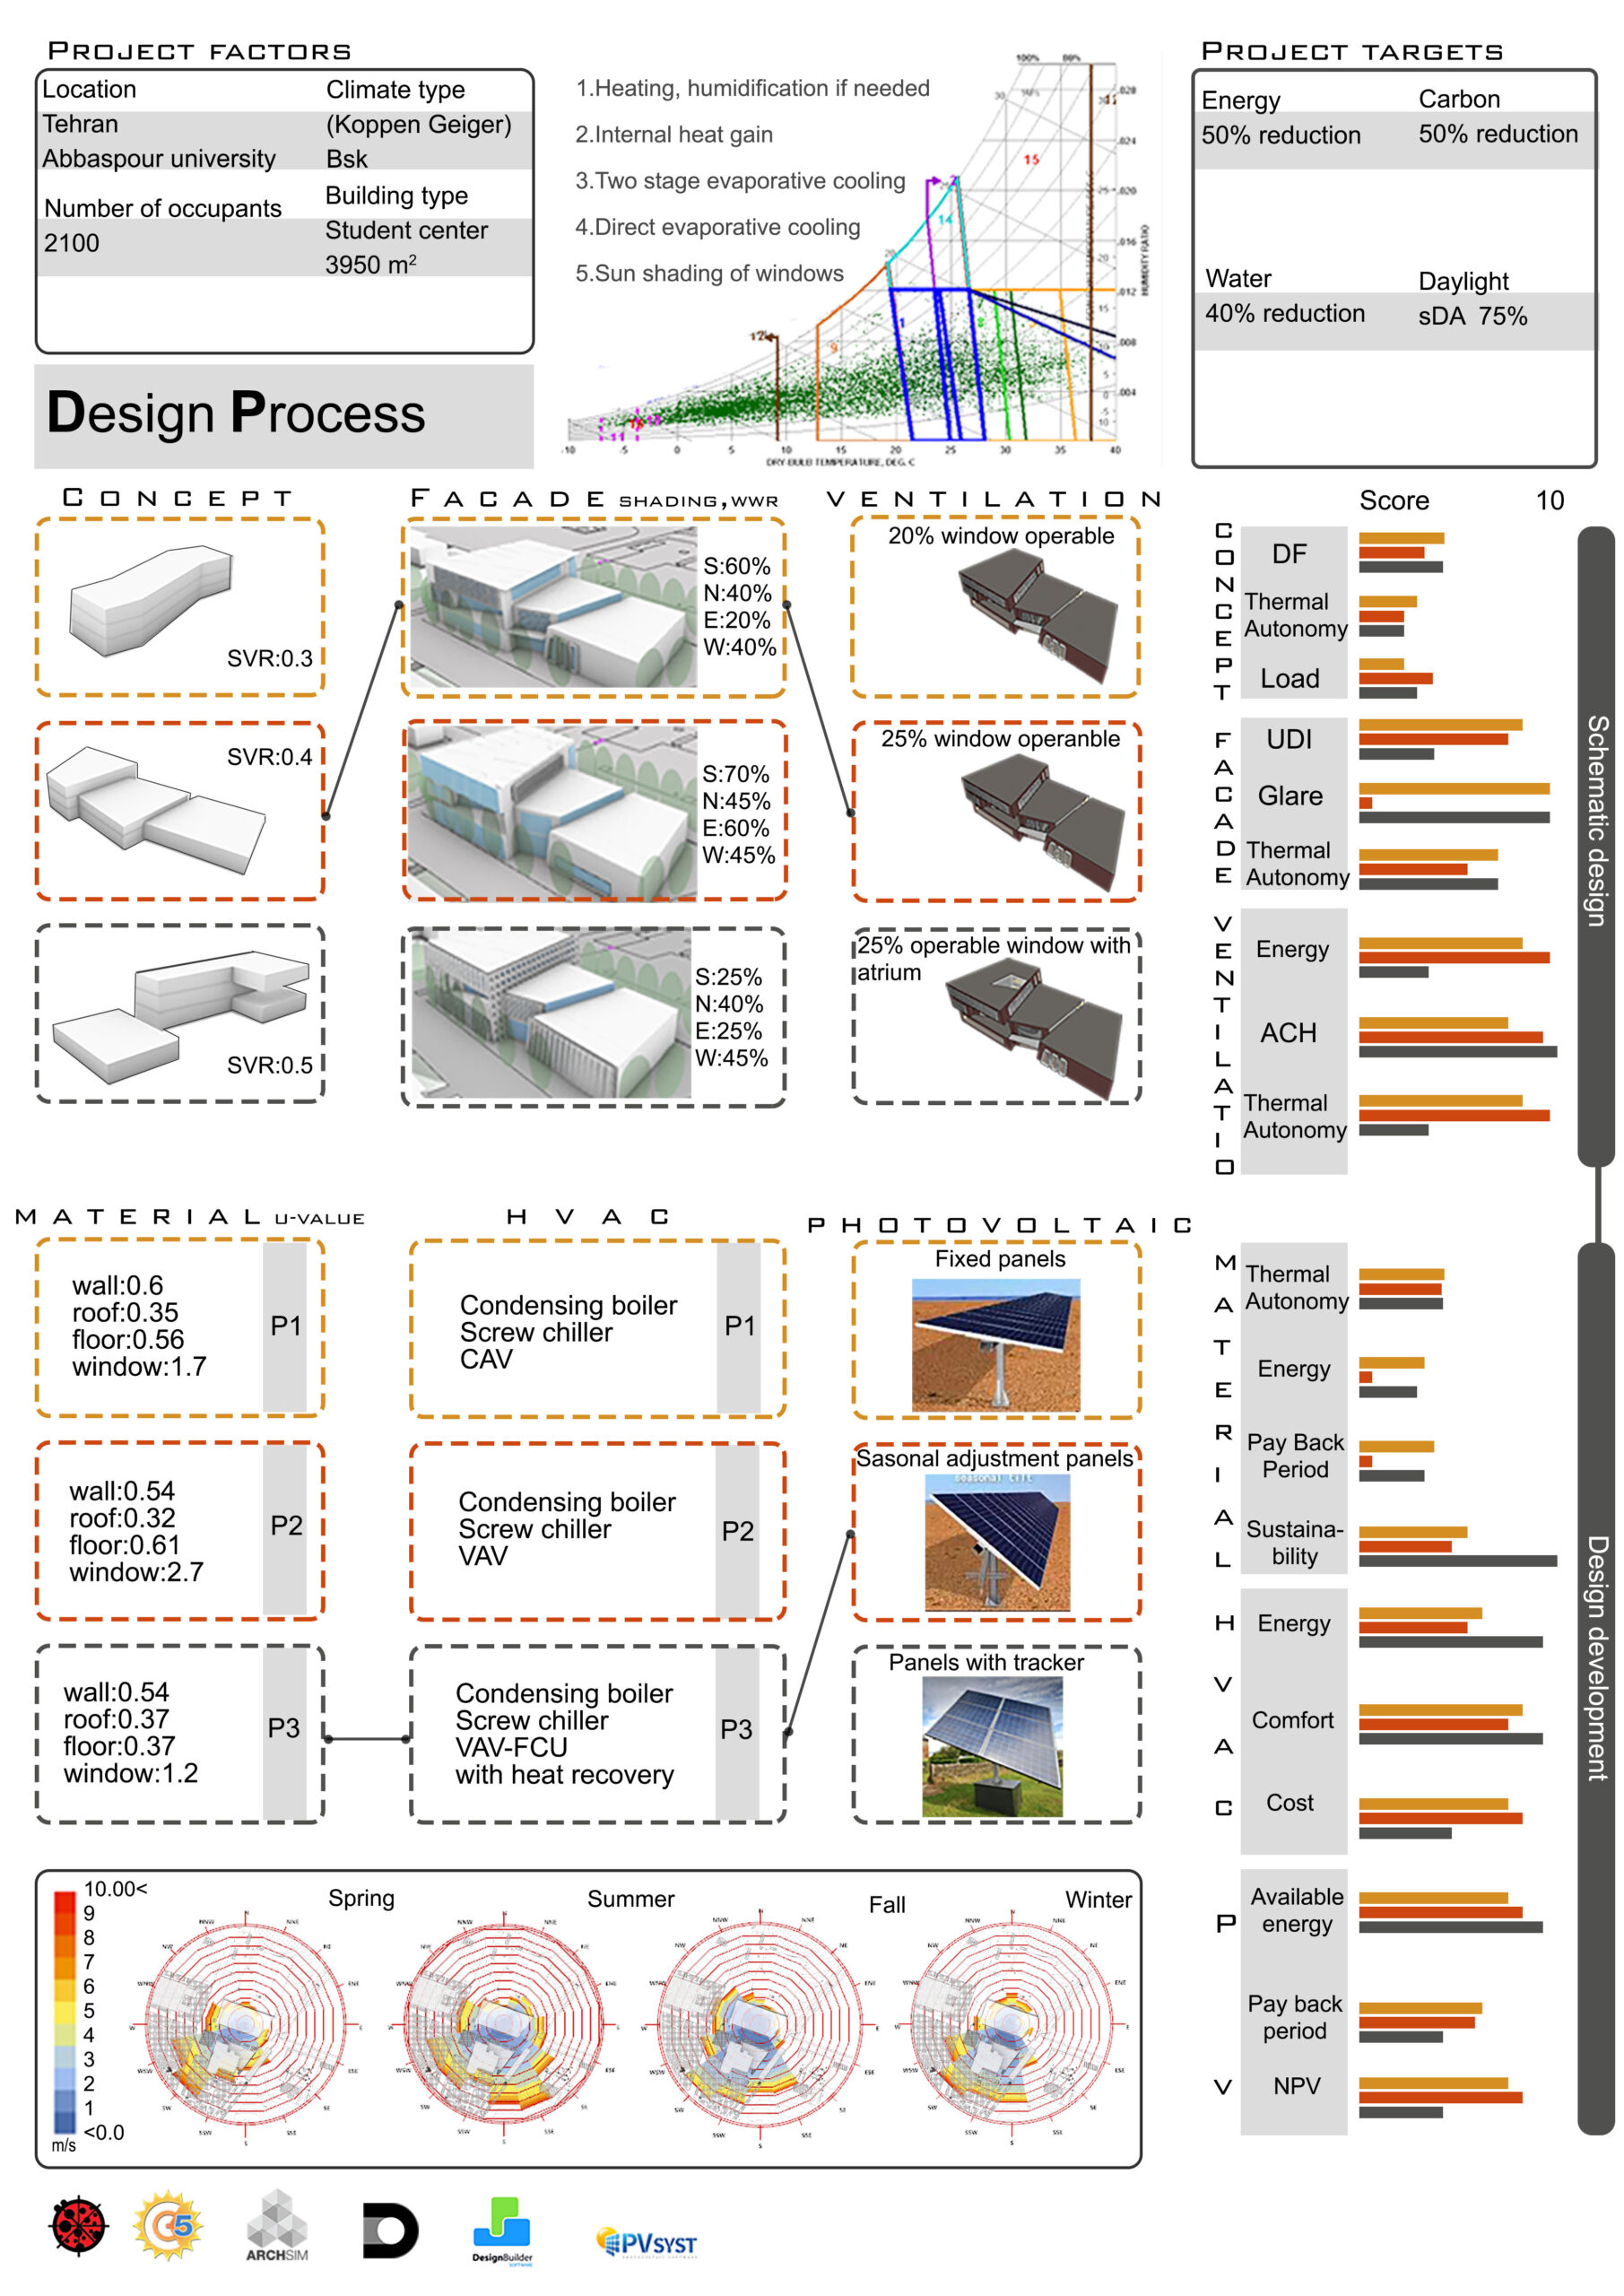
The graphic is a design process of a student center with about 2100 occupants in a university. There are three main design levels: analyzing climate and passive strategies opportunities, schematic design, and detail design. In each level nine alternatives have been simulated and analyzed and the results in several aspects are compared. the best options are selected and the final results are reported based on INBR(Iran National Building Regulation), LEED, Energy Star, and RET screen.
What type of graphic is this?
- Other
- Case Study / Multiple
Design Variables
- Building Massing
- Building Materials
- Glass U-value / SHGC
- Glazing Fraction/Window to Wall ratio
- HVAC performance/system selection
- Insulation R-value
- Passive strategies
- Renewable energy
- Window shading/sun control
What tools were used for the simulation analysis?
- Design Builder
- DIVA
- Excel
- Ladybug Tools
- Other
What tools did you use to create the graphic?
- Adobe Photoshop
- Grasshopper/Rhino
What was successful and/or unique about the graphic in how it communicates information?
displaying alternatives with related simulation results as simply as possible
Is there anything else you would like to mention?
Supplementary Graphics
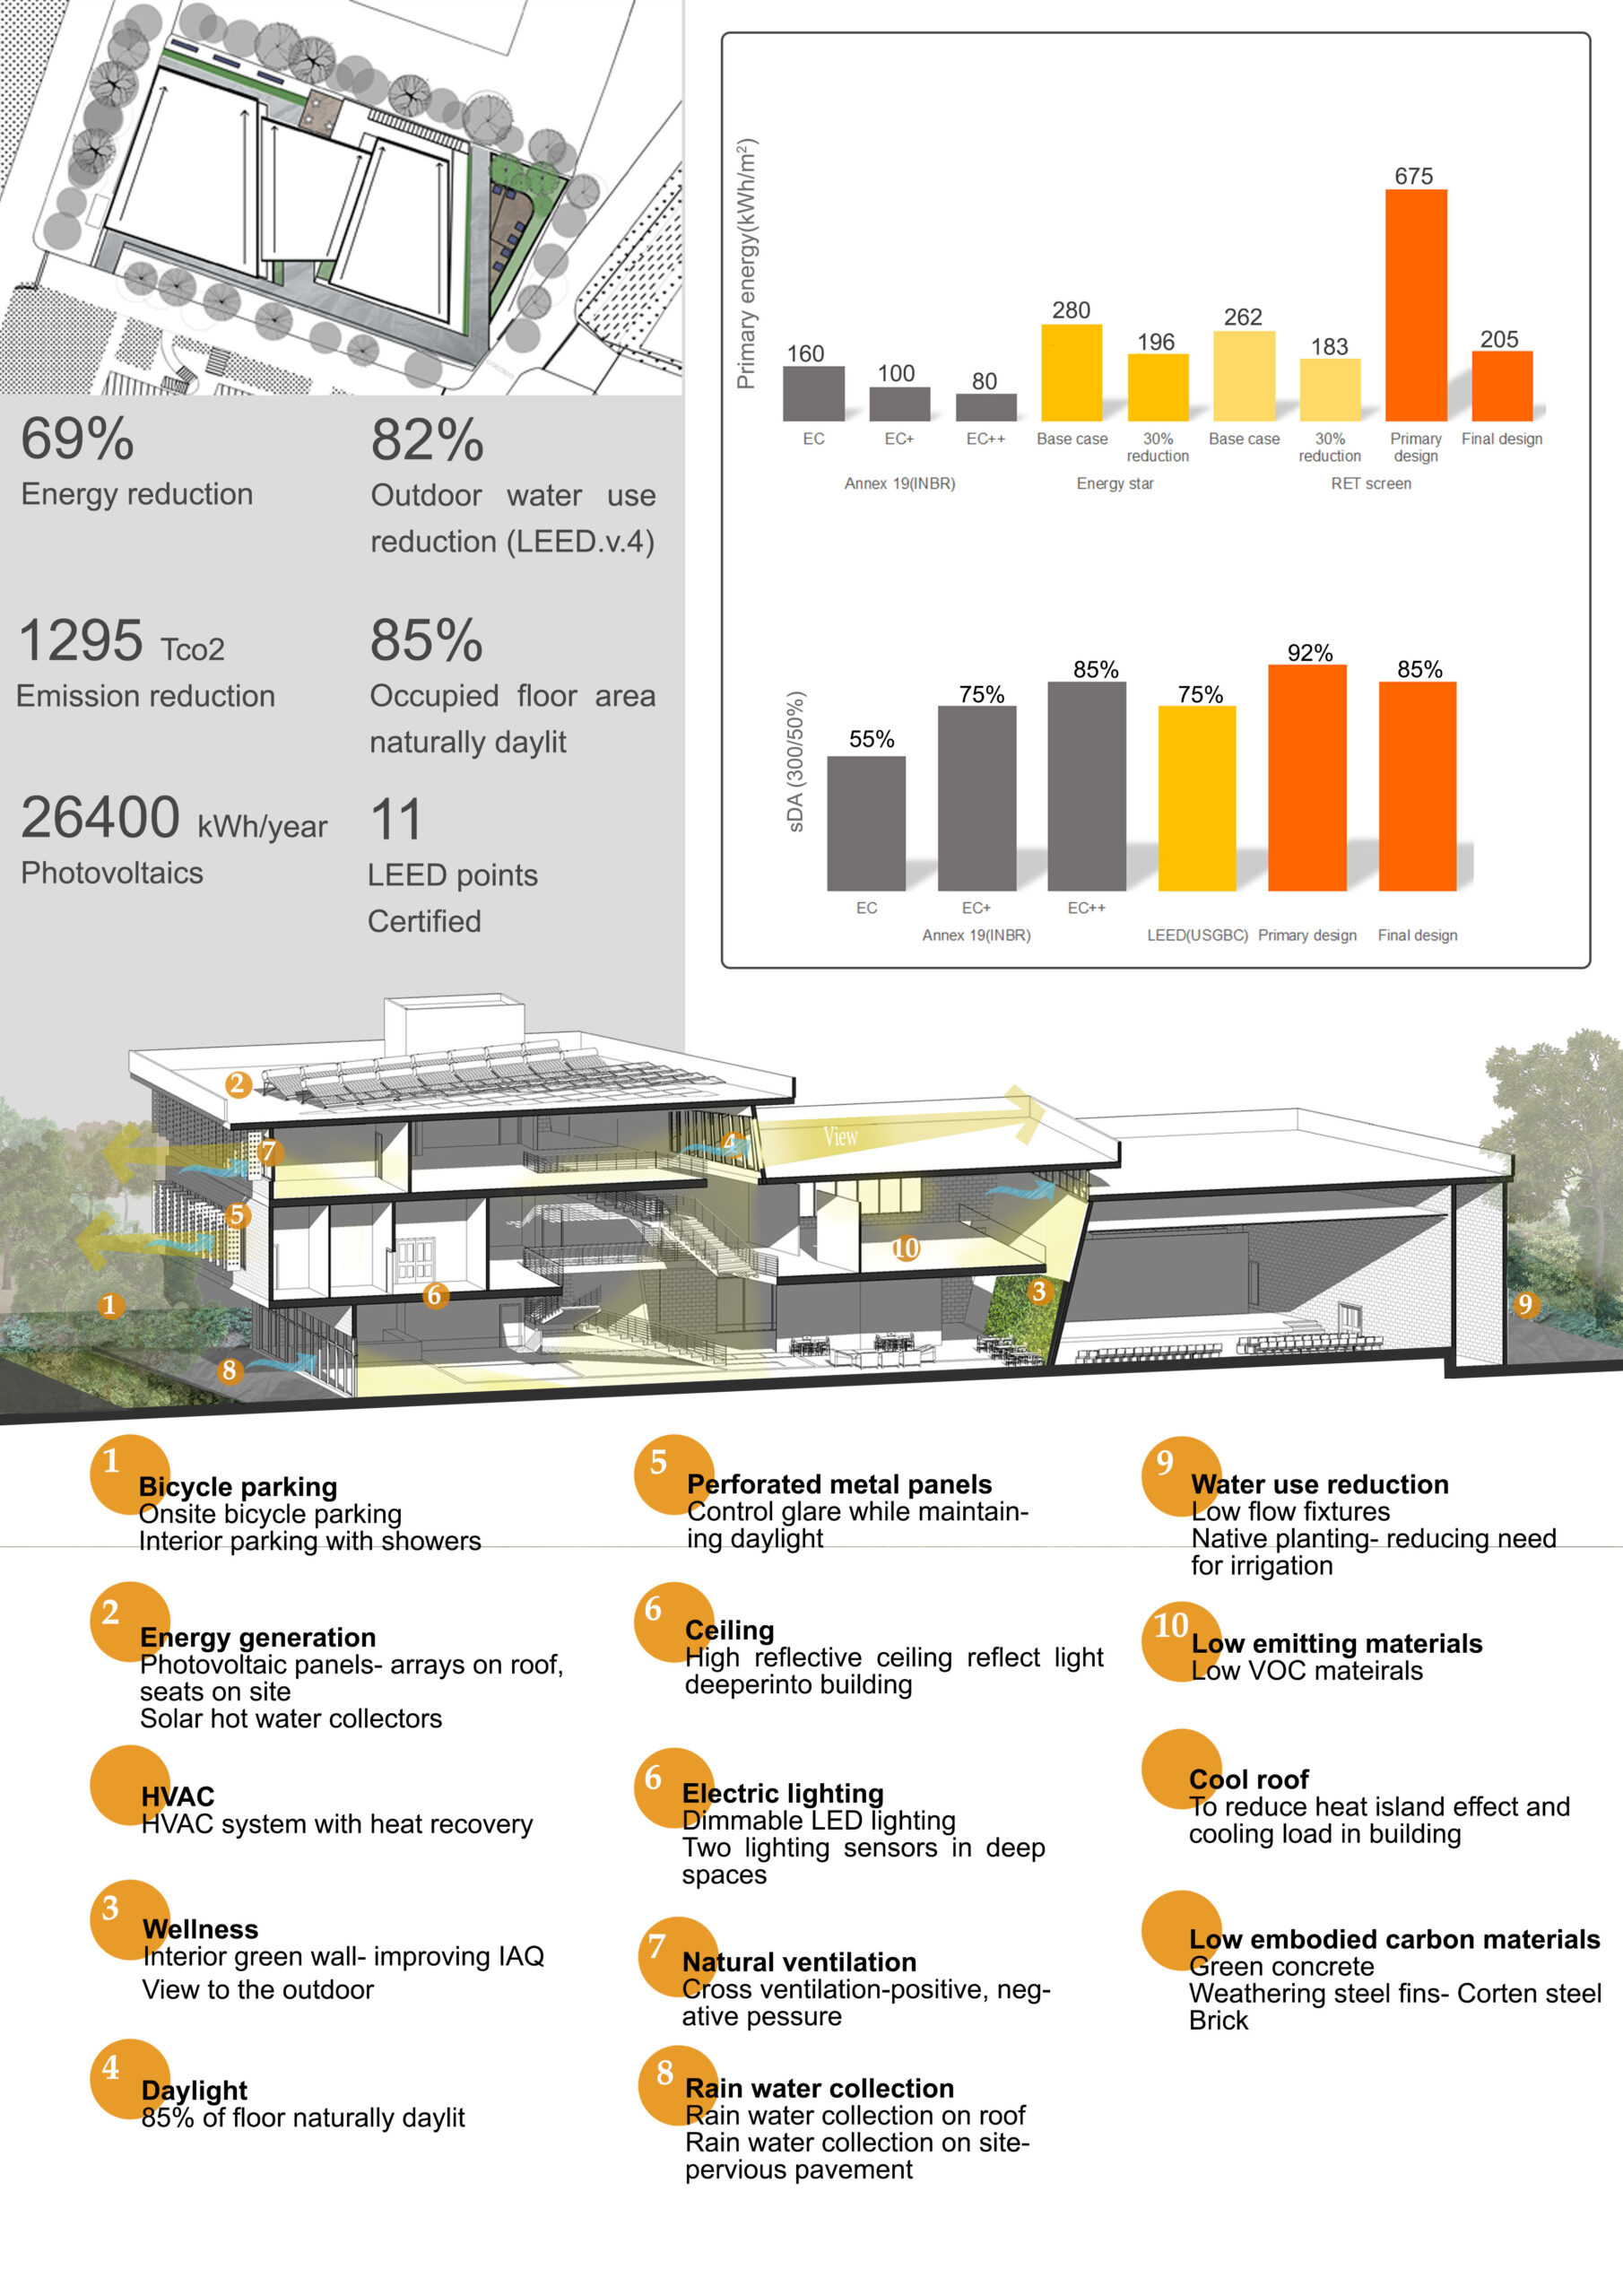
Results and Solutions
Included in the competition:

2023 Annual StaSIO Challenge
March 21, 2023-June 12, 2023