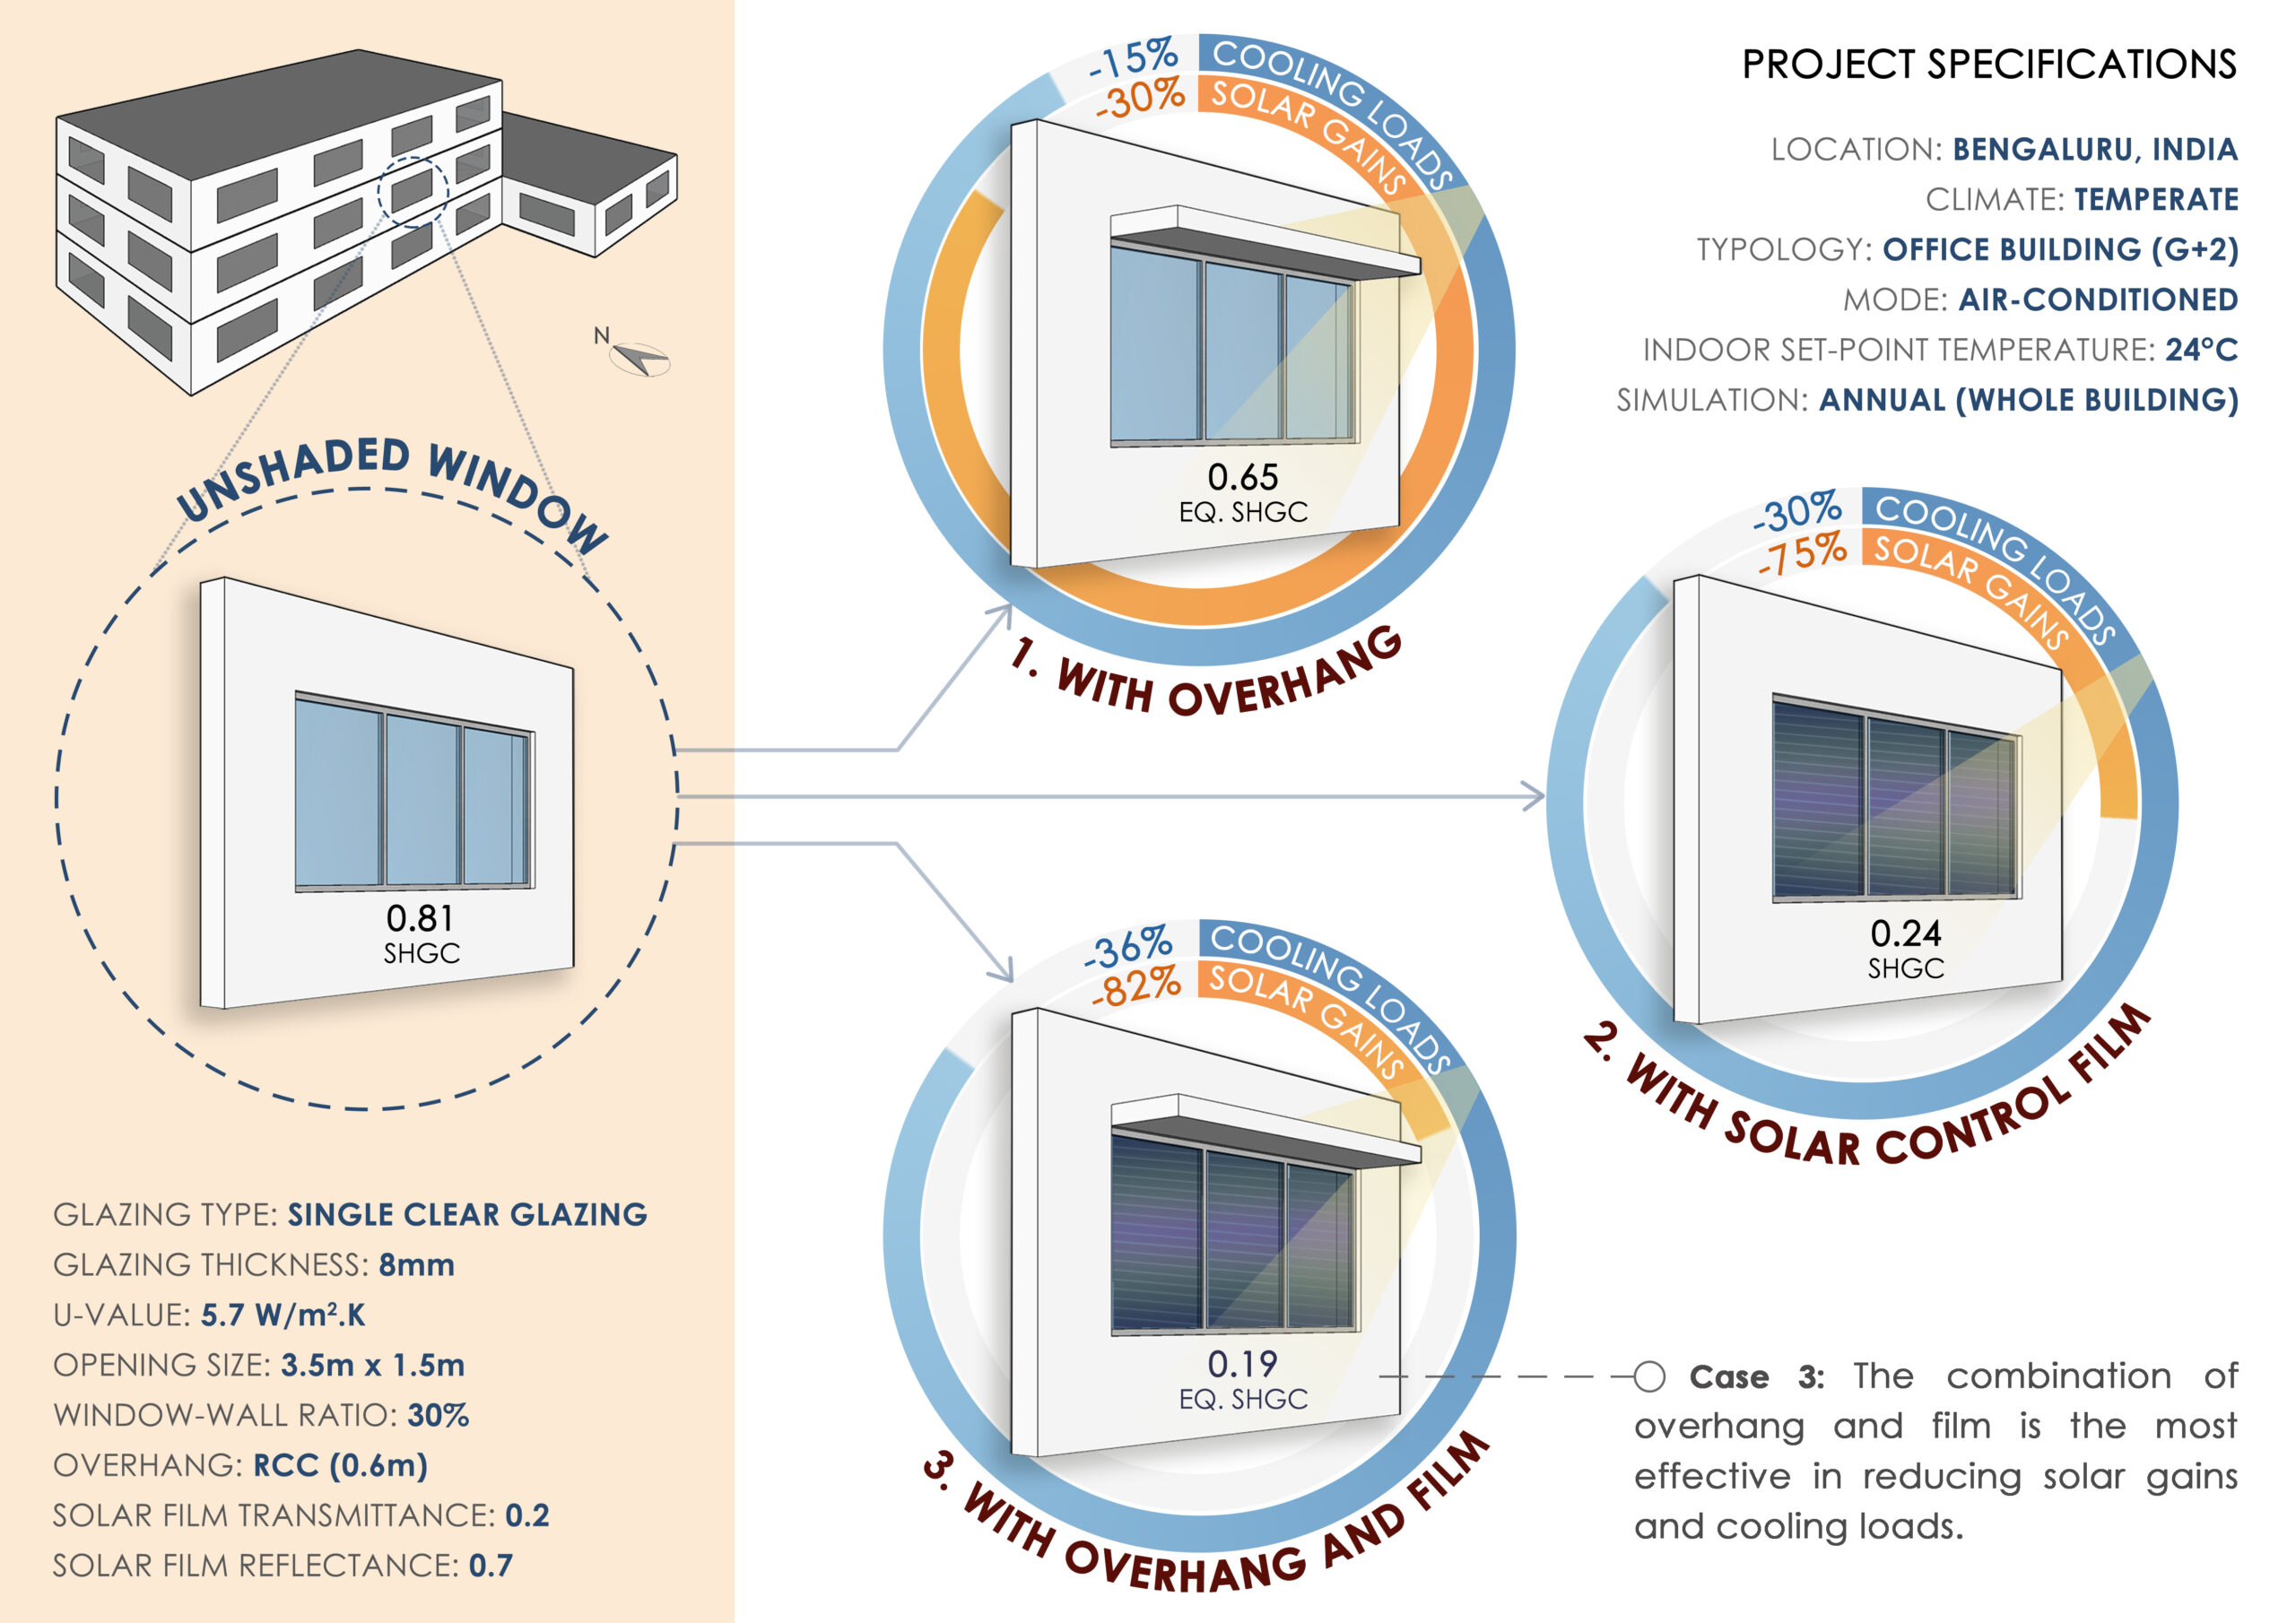
What is the impact of shading and solar films on radiative gains and cooling loads?

Project Location: Aw
Simulation Scale: Whole Building
Application: Conceptual
Audience: Academic
What is this graphic showing? Describe the different parts of the graphic and how it communicates the data.
This graphic shows the results of a simulation carried out to evaluate the reduction in solar gains through external glazing units and cooling loads with the addition of window overhangs and solar control films. Overhangs and SCFs contribute to the reduction in SHGC of the glazing unit. Radiative gains through windows reduce significantly with low SHGC glass.
What type of graphic is this?
- Diagram
Design Variables
- Glass U-value / SHGC
- Window shading/sun control
Is this part of the ASHRAE-209 cycle?
- Cycle 1 Simple Box Model
What tools were used for the simulation analysis?
- Design Builder
- Excel
What tools did you use to create the graphic?
- Adobe Photoshop
- Other
What was successful and/or unique about the graphic in how it communicates information?
Solar gains and cooling demand reductions are illustrated in a very simple manner for each case. It also helps identify the most effective iteration for enhanced building performance. Furthermore, data visualization through infographics is helpful in depicting complex information in a format that is appealing and easy to understand.
Is there anything else you would like to mention?
An annual simulation was run for the whole building. The primary inputs were different SHGCs or equivalent SHGCs of the glazing units – unshaded, shaded and with or without solar control film. A standard overhang depth of 0.6m is considered. Other parameters like the U-value of the glass (5.7 W/m^2.K) and WWR (30%) are kept constant.
Included in the competition:
2024 Annual Project StaSIO Challenge - Deadline 03.30.24
January 18, 2024-November 22, 2024

