What is the impact of sunshade sizing on facade solar loads?
Project Location:
Simulation Scale:
Application:
Audience:
What is this graphic showing? Describe the different parts of the graphic and how it communicates the data.
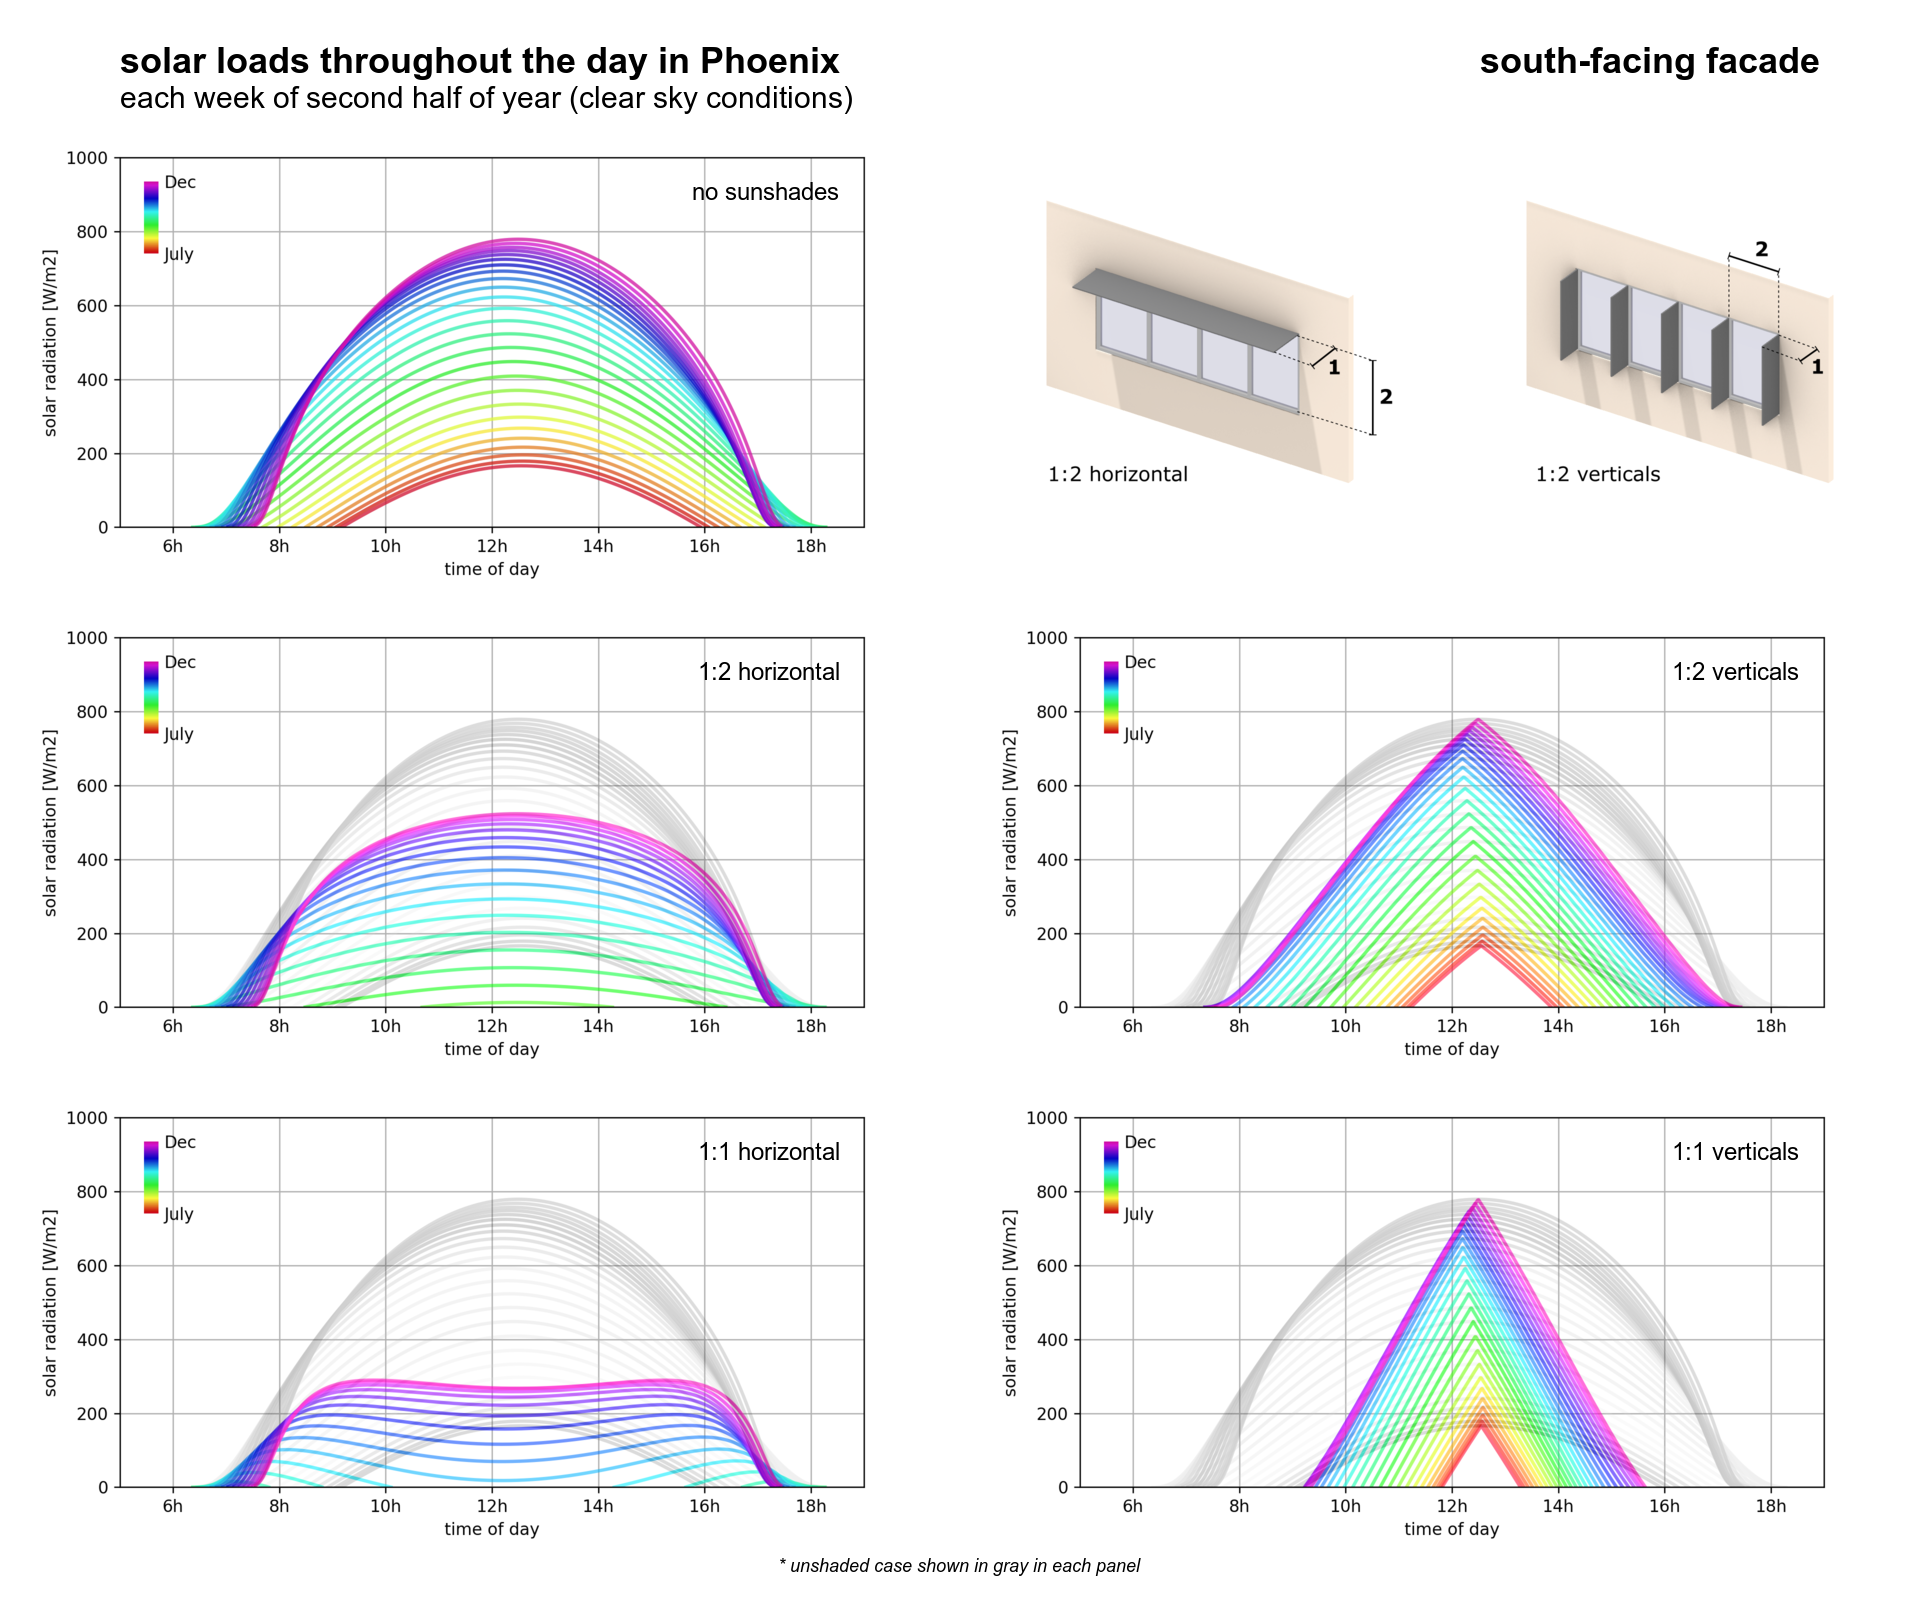
The graphic shows how solar loads on a facade vary throughout the day and year under different shading strategies. In combination with climate data and/or an energy model to identify when mechanical loads are the highest, the information here can be used to identify which shading strategies are most effective at reducing peak mechanical loads by reducing the solar contribution at those times.
What type of graphic is this?
Design Variables
- Passive strategies
- Window shading/sun control
Is this part of the ASHRAE-209 cycle?
- Cycle 1 Simple Box Model
What tools were used for the simulation analysis?
What tools did you use to create the graphic?
- Python
What was successful and/or unique about the graphic in how it communicates information?
The graphic shows not just if sunshades are effective, but _when_ they are most and least effective. This is important as some shading strategies may reduce the net energy use of a building, but perform poorly during peak times, leading to localized thermal comfort issues and larger mechanical equipment.
Is there anything else you would like to mention?
Analysis performed entirely in python, using the pvlib library.
Supplementary Graphics
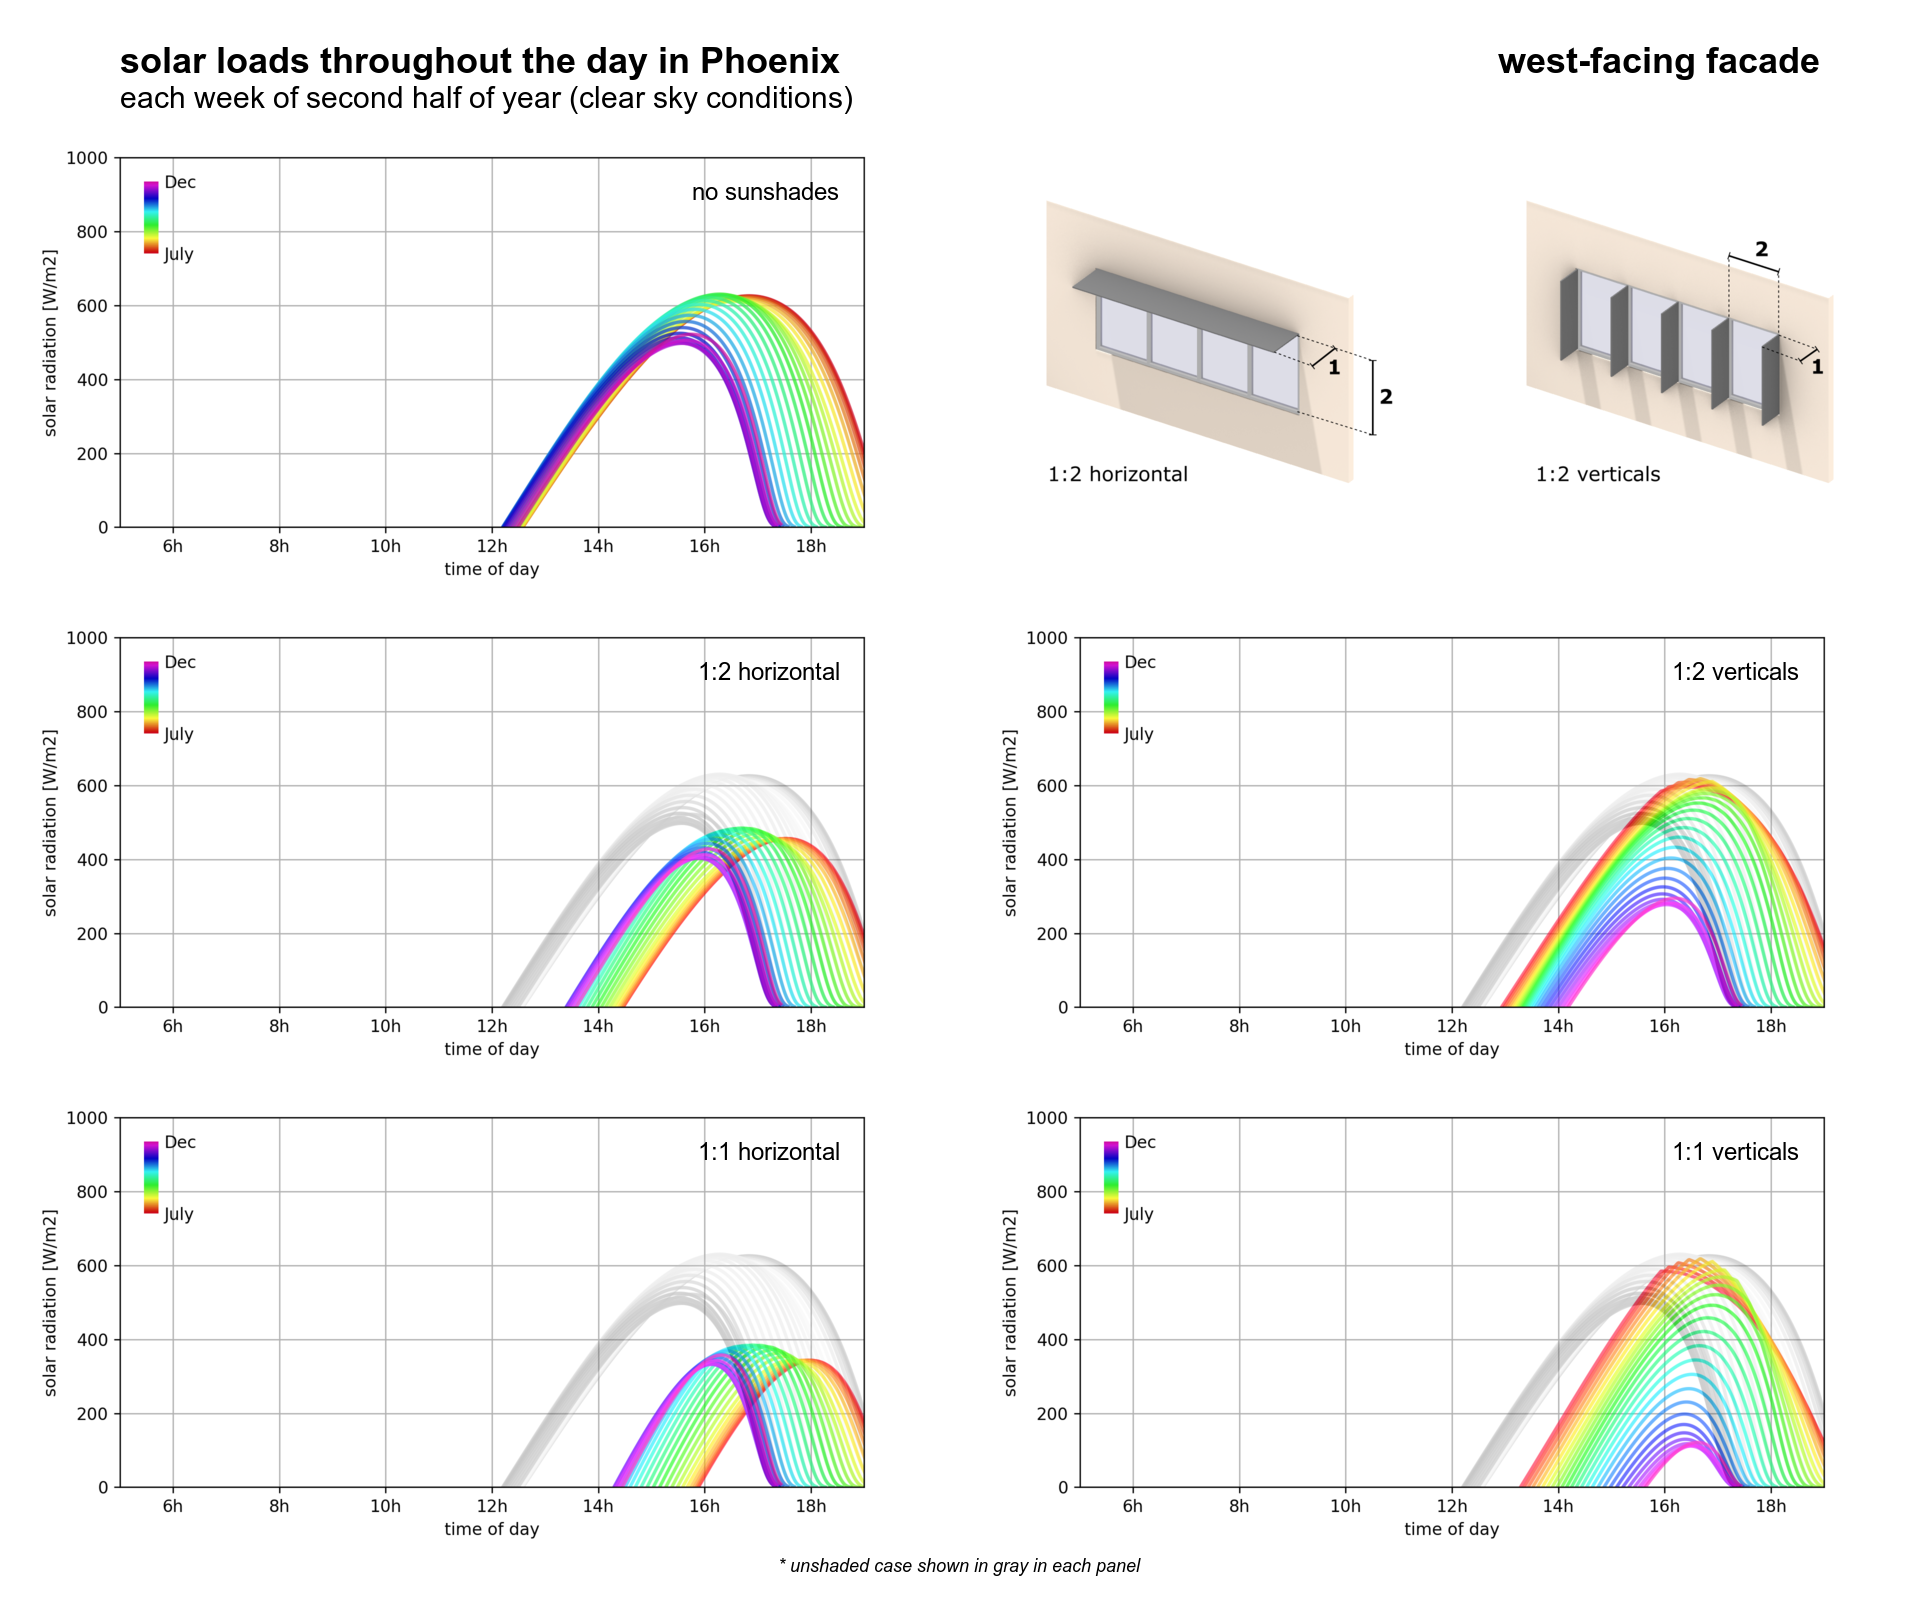
Solar loads throughout the day under different shading strategies (west-facing facade).
Included in the competition:

Solar Shading and Building Performance
January 7, 2021-February 8, 2021