What is the impact of various shading strategies on building energy use and mechanical savings??
Project Location:
Simulation Scale:
Application:
Audience:
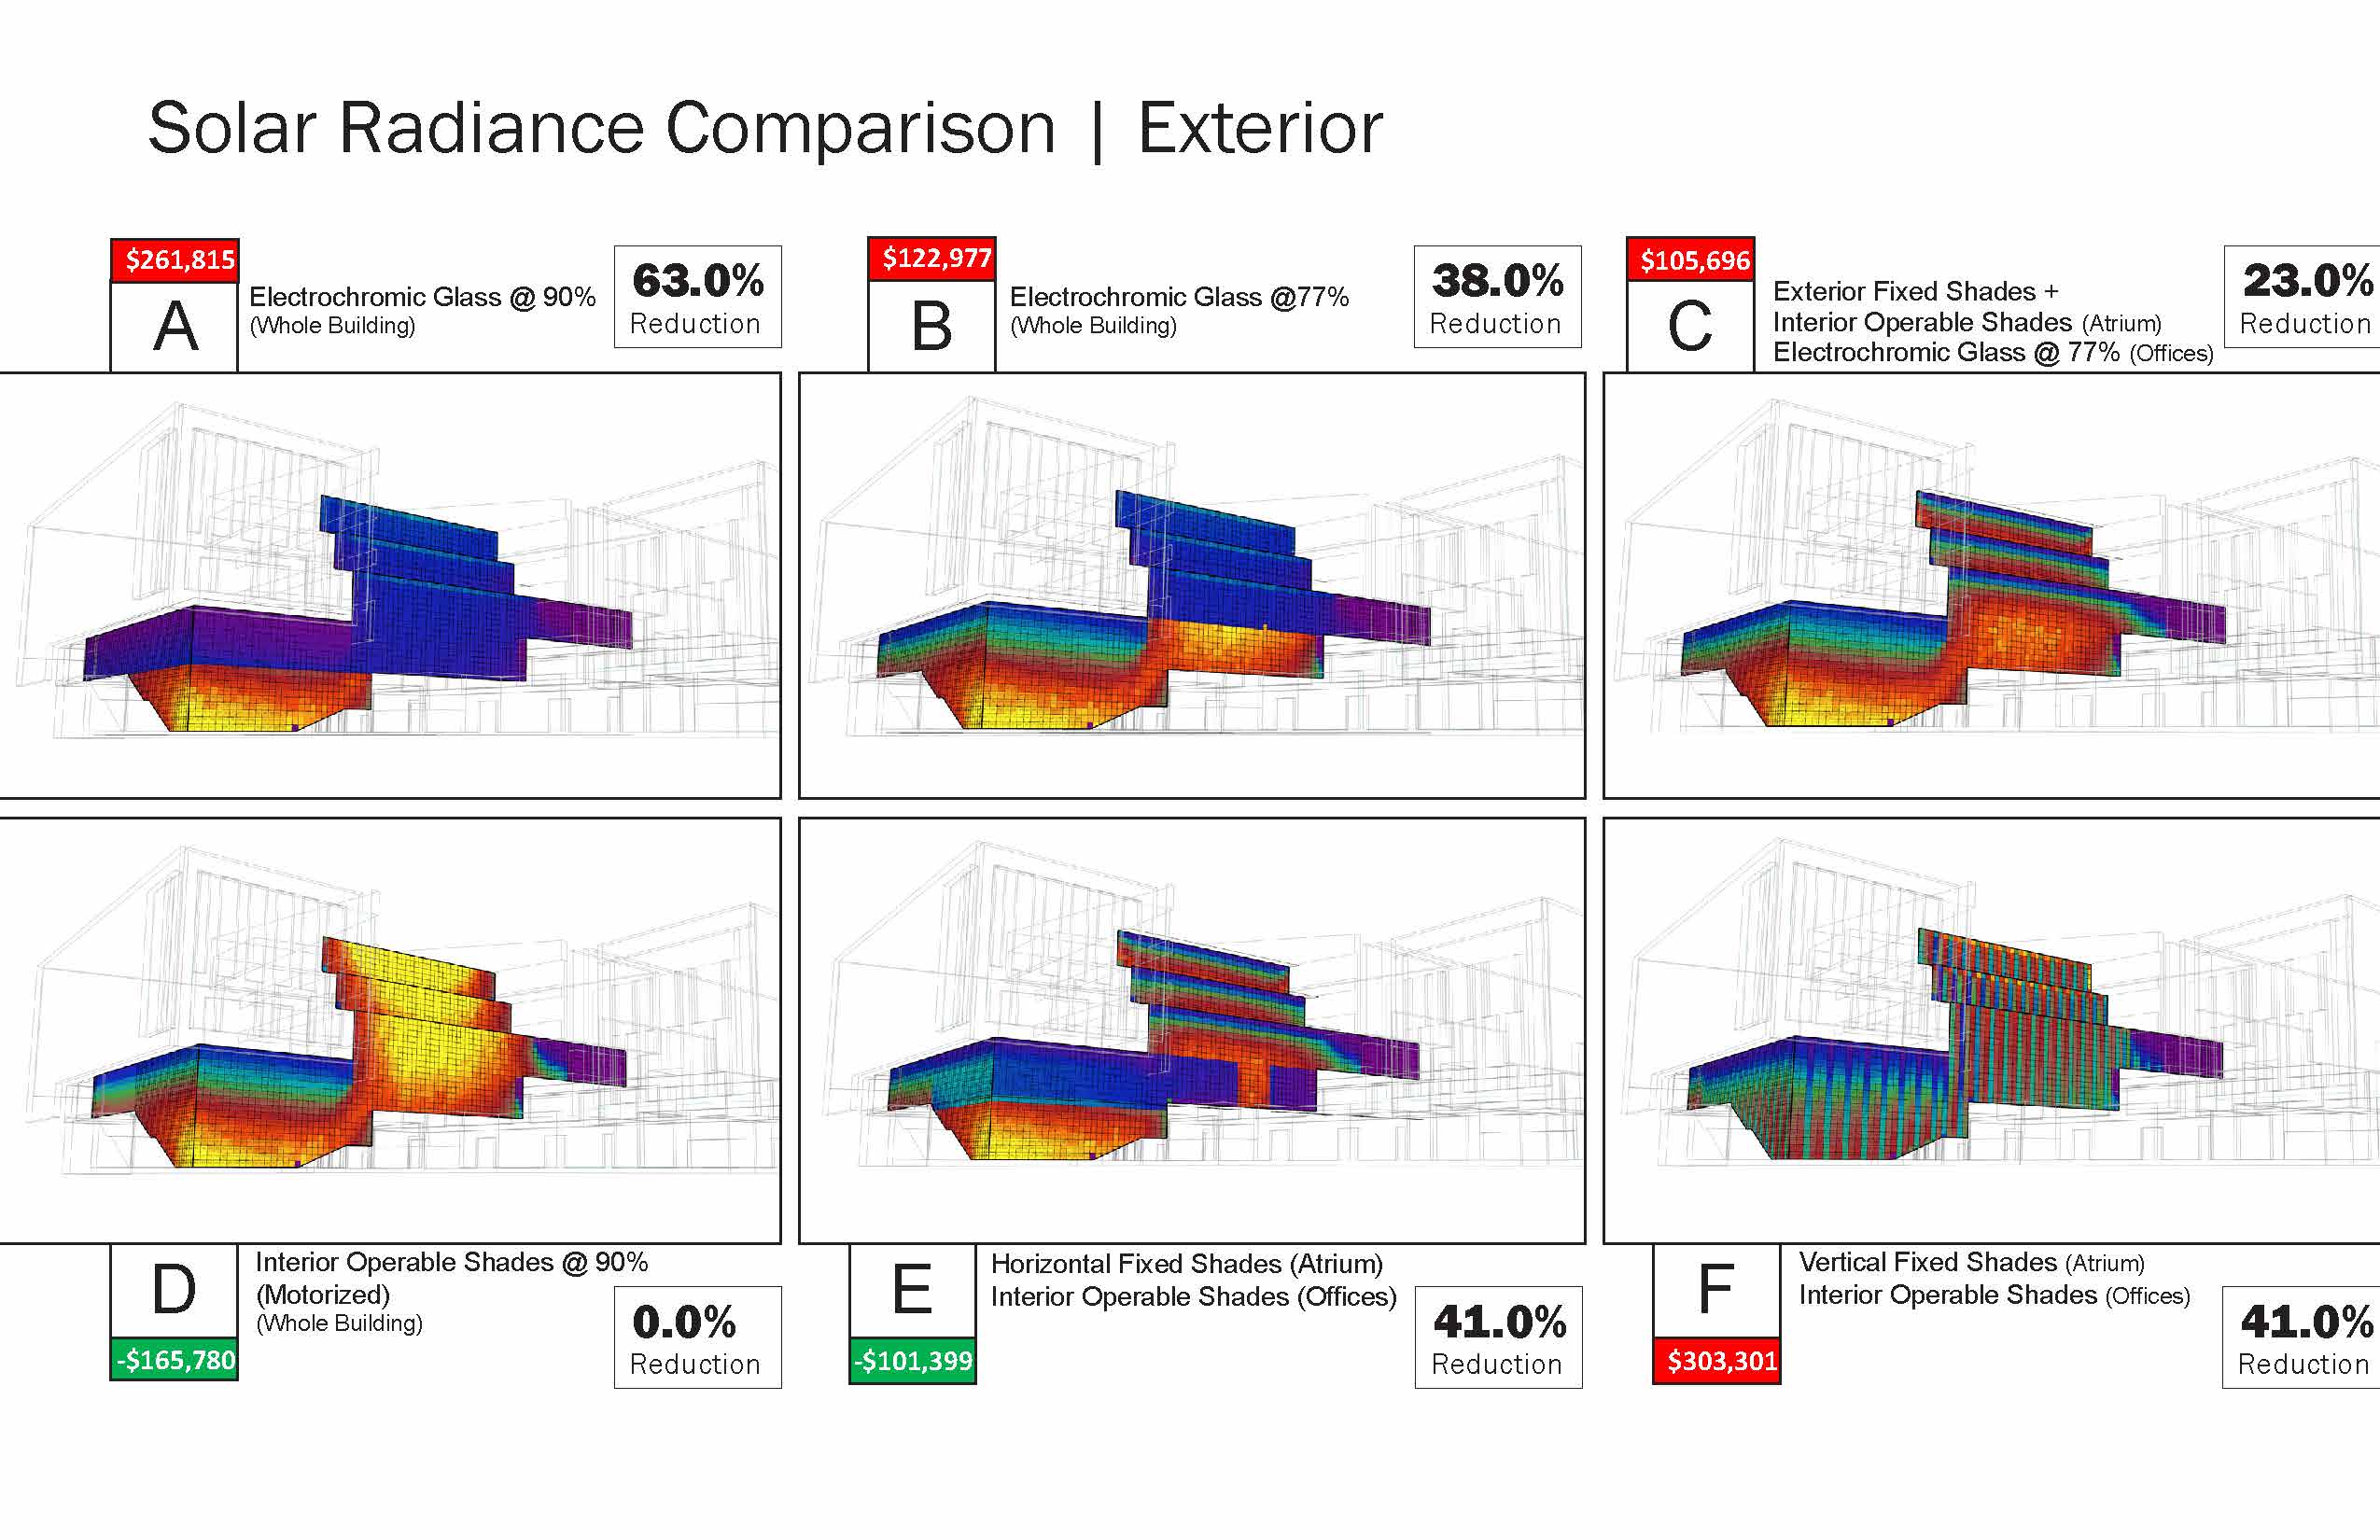
What is this graphic showing? Describe the different parts of the graphic and how it communicates the data.
This graphic shows an analysis of various solar shading strategies using a radiance grid overlaid on 3D building massing as well as details on the EUI reduction and Mechanical cost.
Is this part of the ASHRAE-209 cycle?
- Cycle 5 Design Refinement
What tools were used for the simulation analysis?
- DIVA
What tools did you use to create the graphic?
- Adobe Illustrator
- Adobe Indesign
- Adobe Photoshop
What was successful and/or unique about the graphic in how it communicates information?
It lays multiple analysis information onto a single graphic in order to guide design decisions.
Is there anything else you would like to mention?
Supplementary Graphics
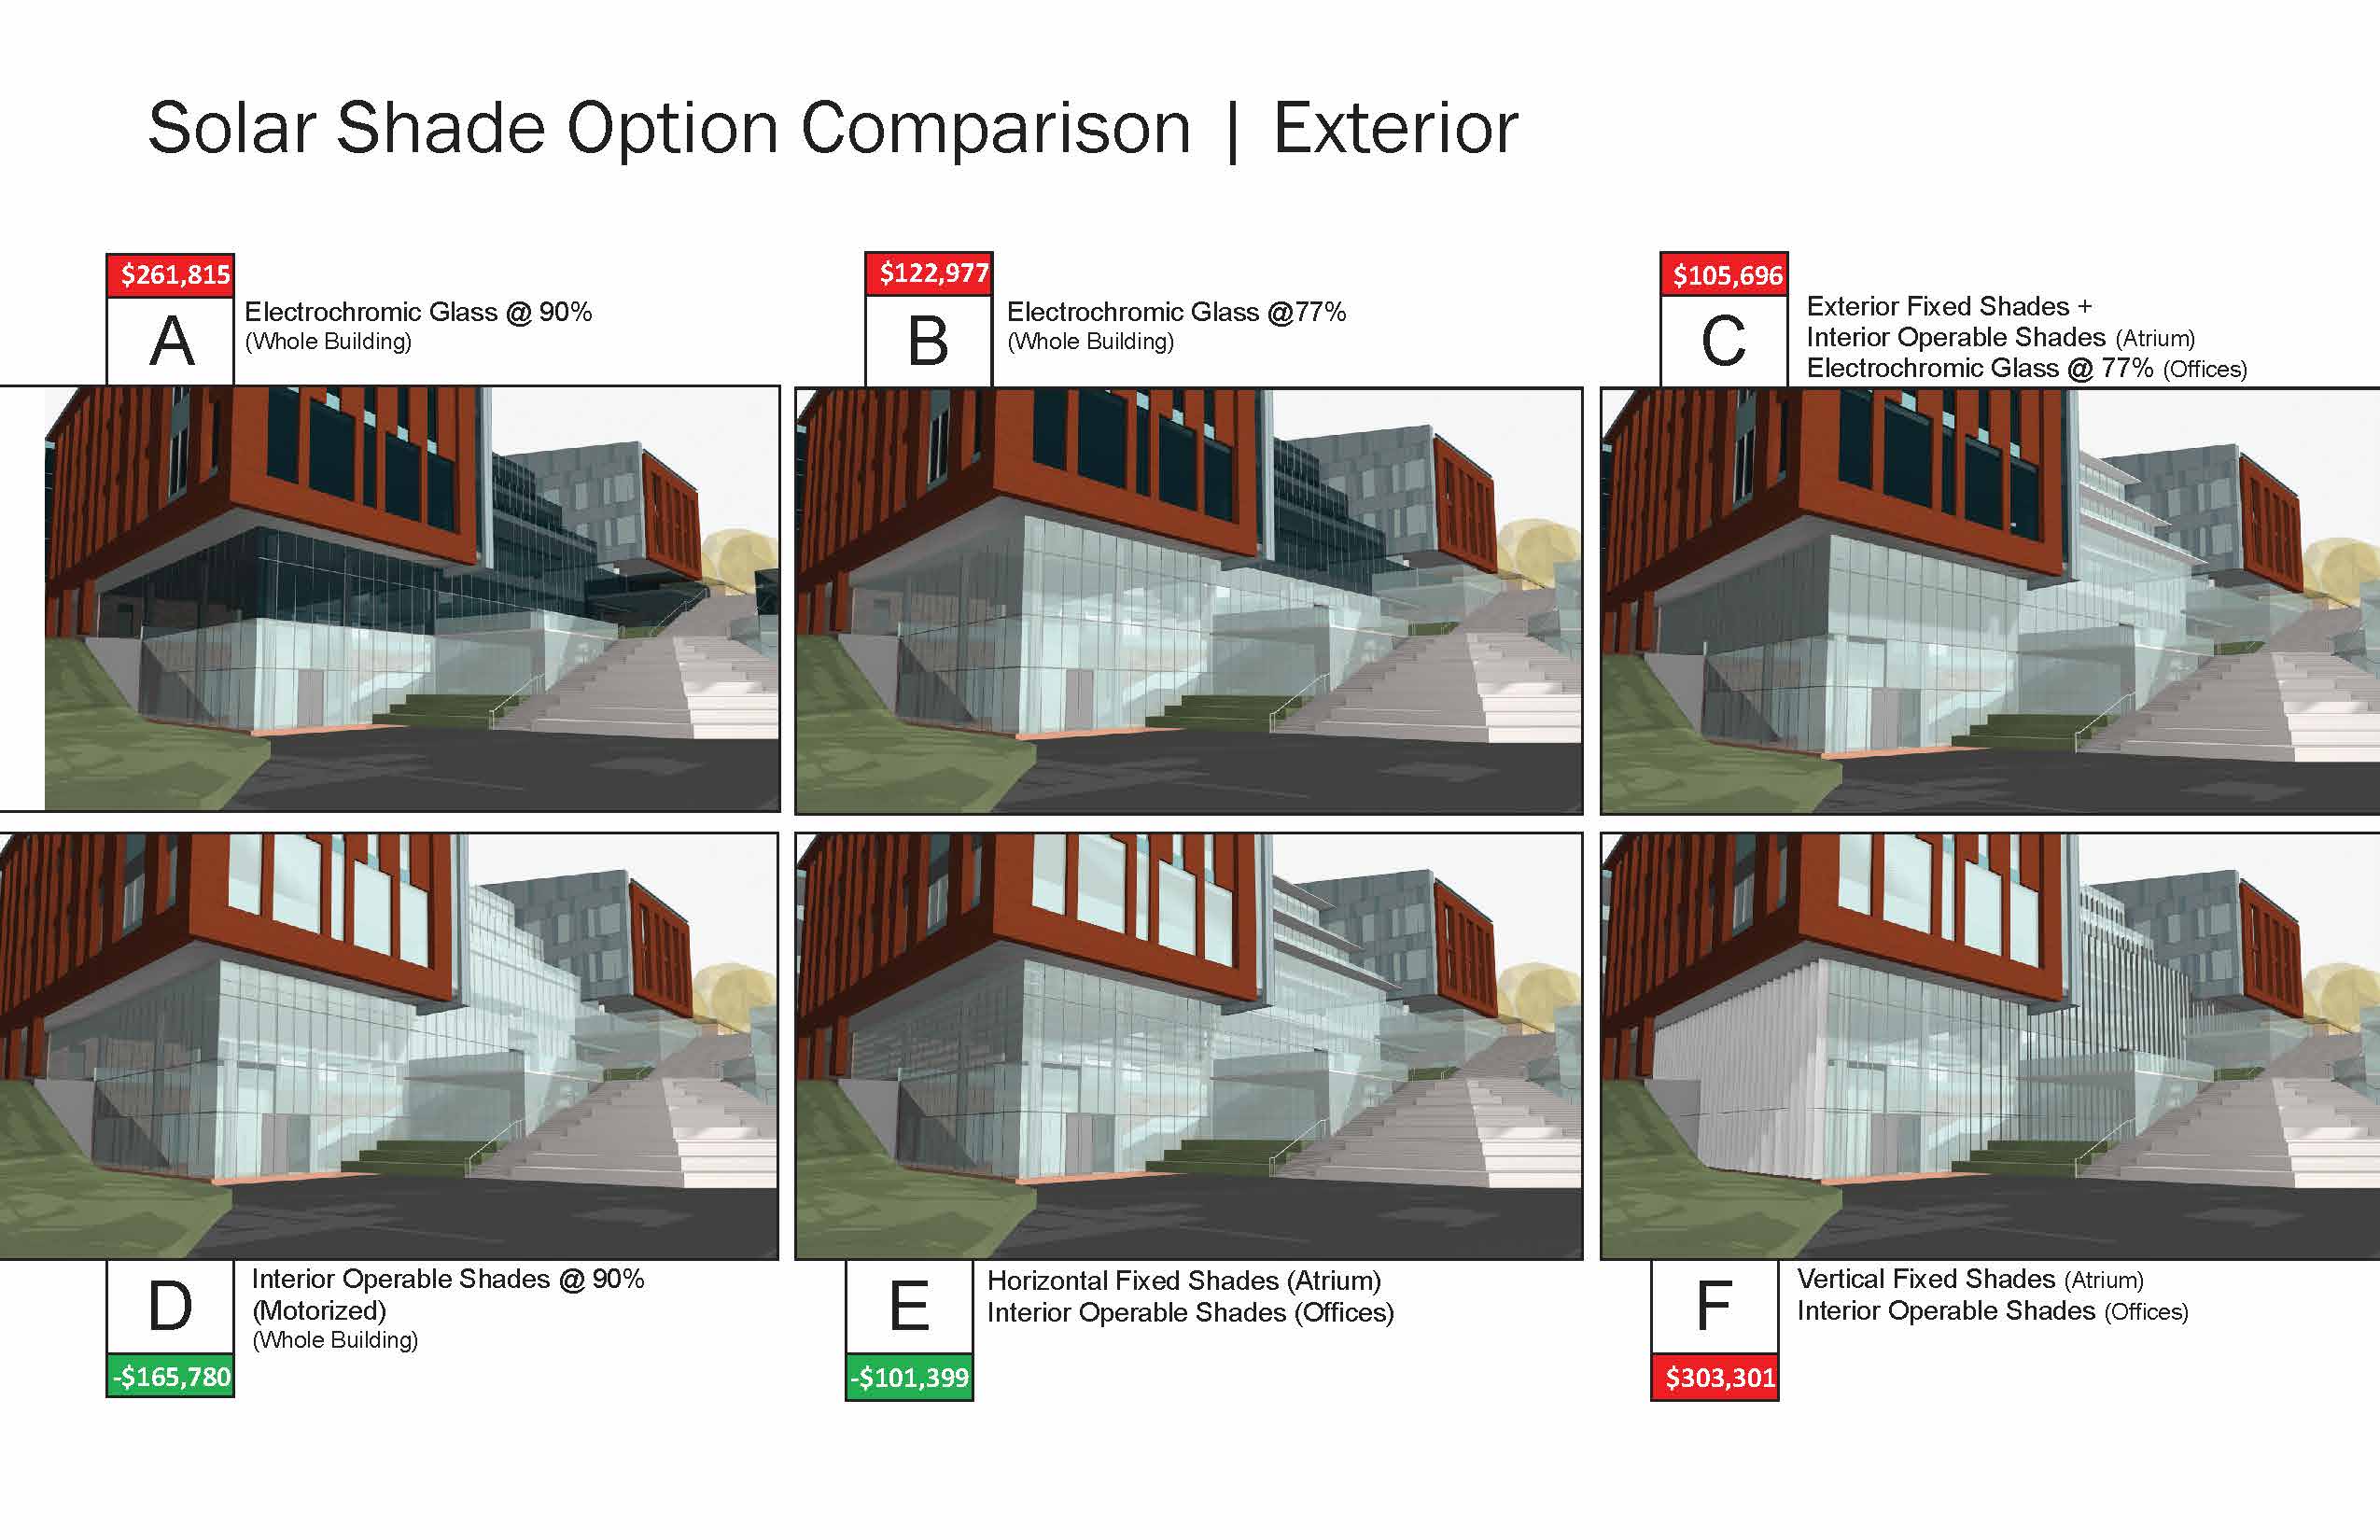
renderings of the different options
Included in the competition:
Solar Shading and Building Performance
January 7, 2021-February 8, 2021