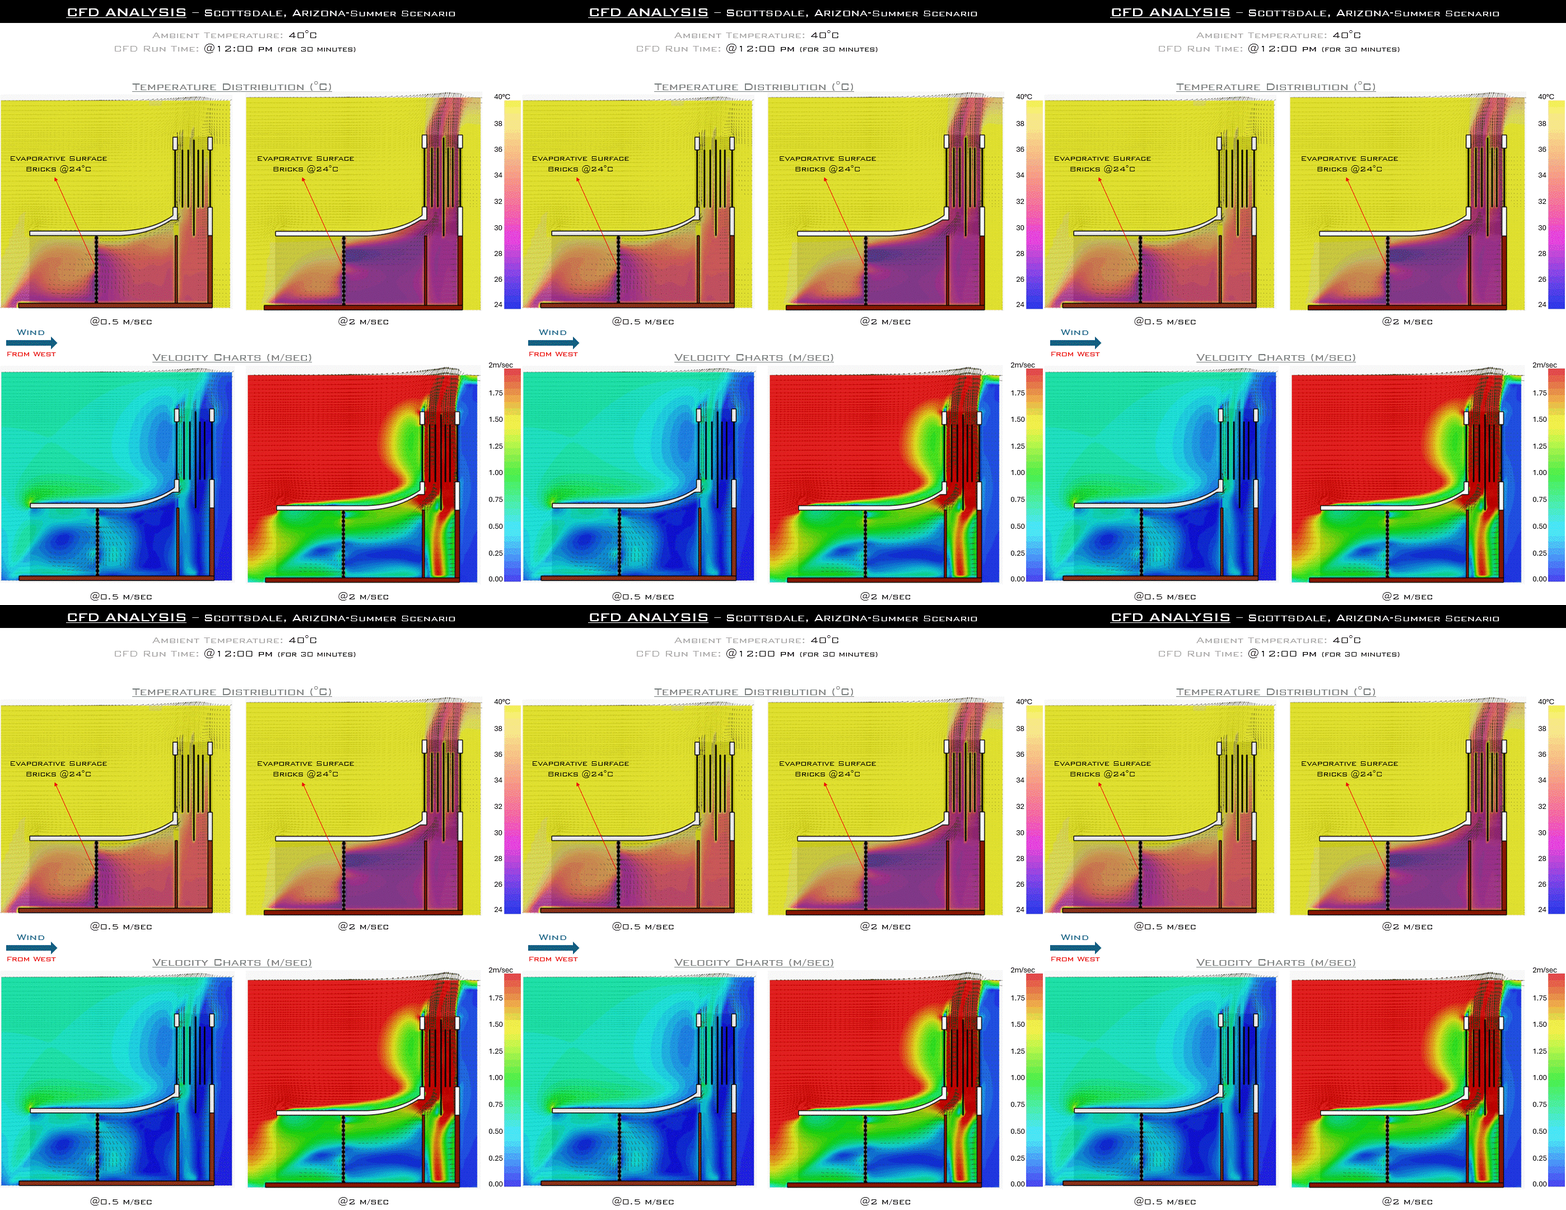
What is the impact of wind speed on ventilation efficiency of a solar chimney?

Project Location: Zone 0A Extremely Hot Humid
Simulation Scale: Whole Building
Application: Research
Audience: Academic
What is this graphic showing? Describe the different parts of the graphic and how it communicates the data.
The space has an evaporative brick mass wall that is at 24°C wet bulb temperature in 40°C Ambient air temperature receiving wind from the West facade that facilitates the evaporative cooling to travel inside the space, increasing the efficiency of the solar chimney. The graphic articulates more cooling inside the space at higher wind speeds.
What type of graphic is this?
- Animated gif
Design Variables
- Passive strategies
Is this part of the ASHRAE-209 cycle?
What tools were used for the simulation analysis?
- Computational Fluid Dynamics
- Other
What tools did you use to create the graphic?
- Grasshopper/Rhino
- Other
- PowerPoint
What was successful and/or unique about the graphic in how it communicates information?
It shows Temperature and velocity charts in juxtaposition to clearly articulate that there is more cooling inside the space at higher wind speeds.
Is there anything else you would like to mention?
The tool used for the analysis was RhinoCFD.
Included in the competition:
2024 Annual Project StaSIO Challenge - Deadline 03.30.24
January 18, 2024-November 22, 2024

