What is the impact of window-wall ratio on annual energy use in an office building?
Project Location: BSh
Simulation Scale: Shoebox Model
Application: Conceptual
Audience: Academic
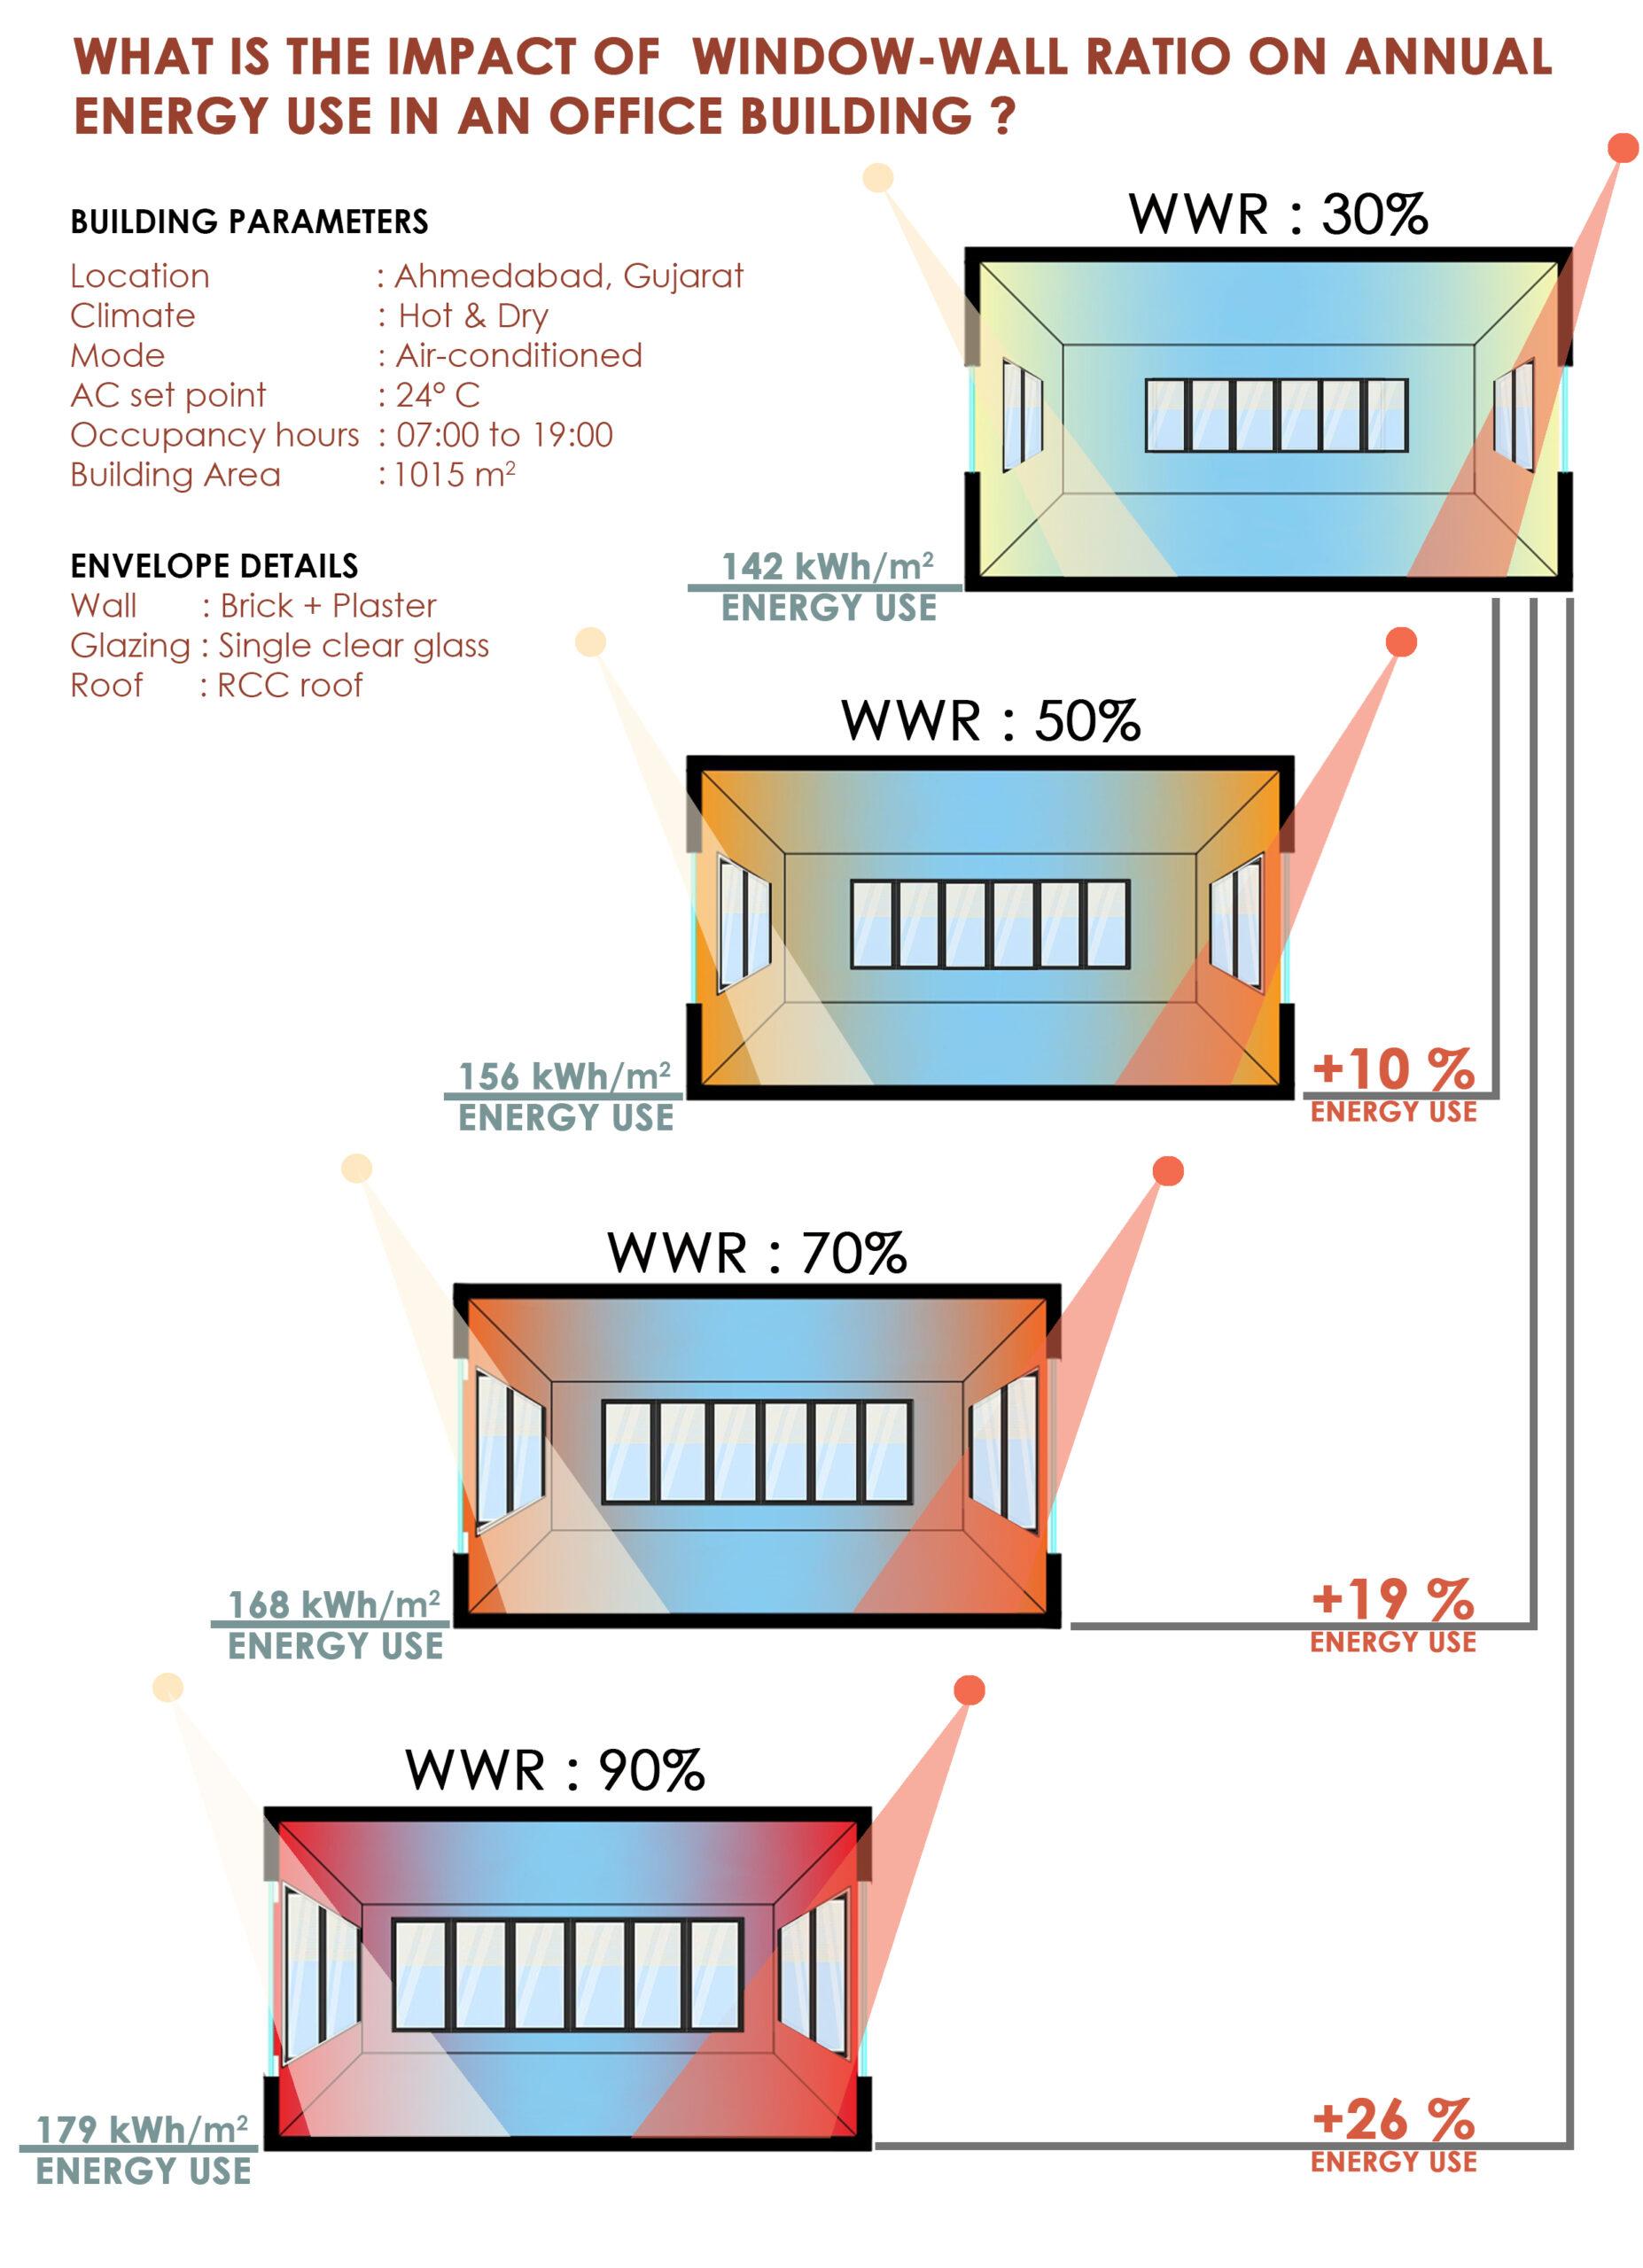
What is this graphic showing? Describe the different parts of the graphic and how it communicates the data.
The graphic consists of four images, beginning with the baseline scenario at 30% Window-to-Wall Ratio (WWR) and progressing to 50%, 70%, and 90% WWR. As the WWR increases, the energy consumption escalates, indicated in percentage and absolute values. The changing color palette within the space visually illustrates the rising heat ingress corresponding to the increased WWR, hence increase in energy use.
What type of graphic is this?
- Diagram
- Analysis grid
Design Variables
- Glazing Fraction/Window to Wall ratio
Is this part of the ASHRAE-209 cycle?
- Cycle 1 Simple Box Model
What tools were used for the simulation analysis?
- Design Builder
- EnergyPlus
- Excel
What tools did you use to create the graphic?
- Adobe Photoshop
- Excel
- Other
- PowerPoint
What was successful and/or unique about the graphic in how it communicates information?
The graphic illustrates both individual and comparative data. It visually depicts the ascending Window-to-Wall Ratio (WWR%) alongside a color palette indicating the rising heat gain through windows. This, in turn, contributes to elevated cooling loads and consequently increases the building's energy consumption.
Is there anything else you would like to mention?
Included in the competition:

2024 Annual Project StaSIO Challenge - Deadline 03.30.24
January 18, 2024-November 22, 2024