What is the impact of WWR on Sensible Cooling Load and Energy Use?
Project Location: Zone 0A Extremely Hot Humid
Simulation Scale: Whole Building
Application: Conceptual
Audience: Academic
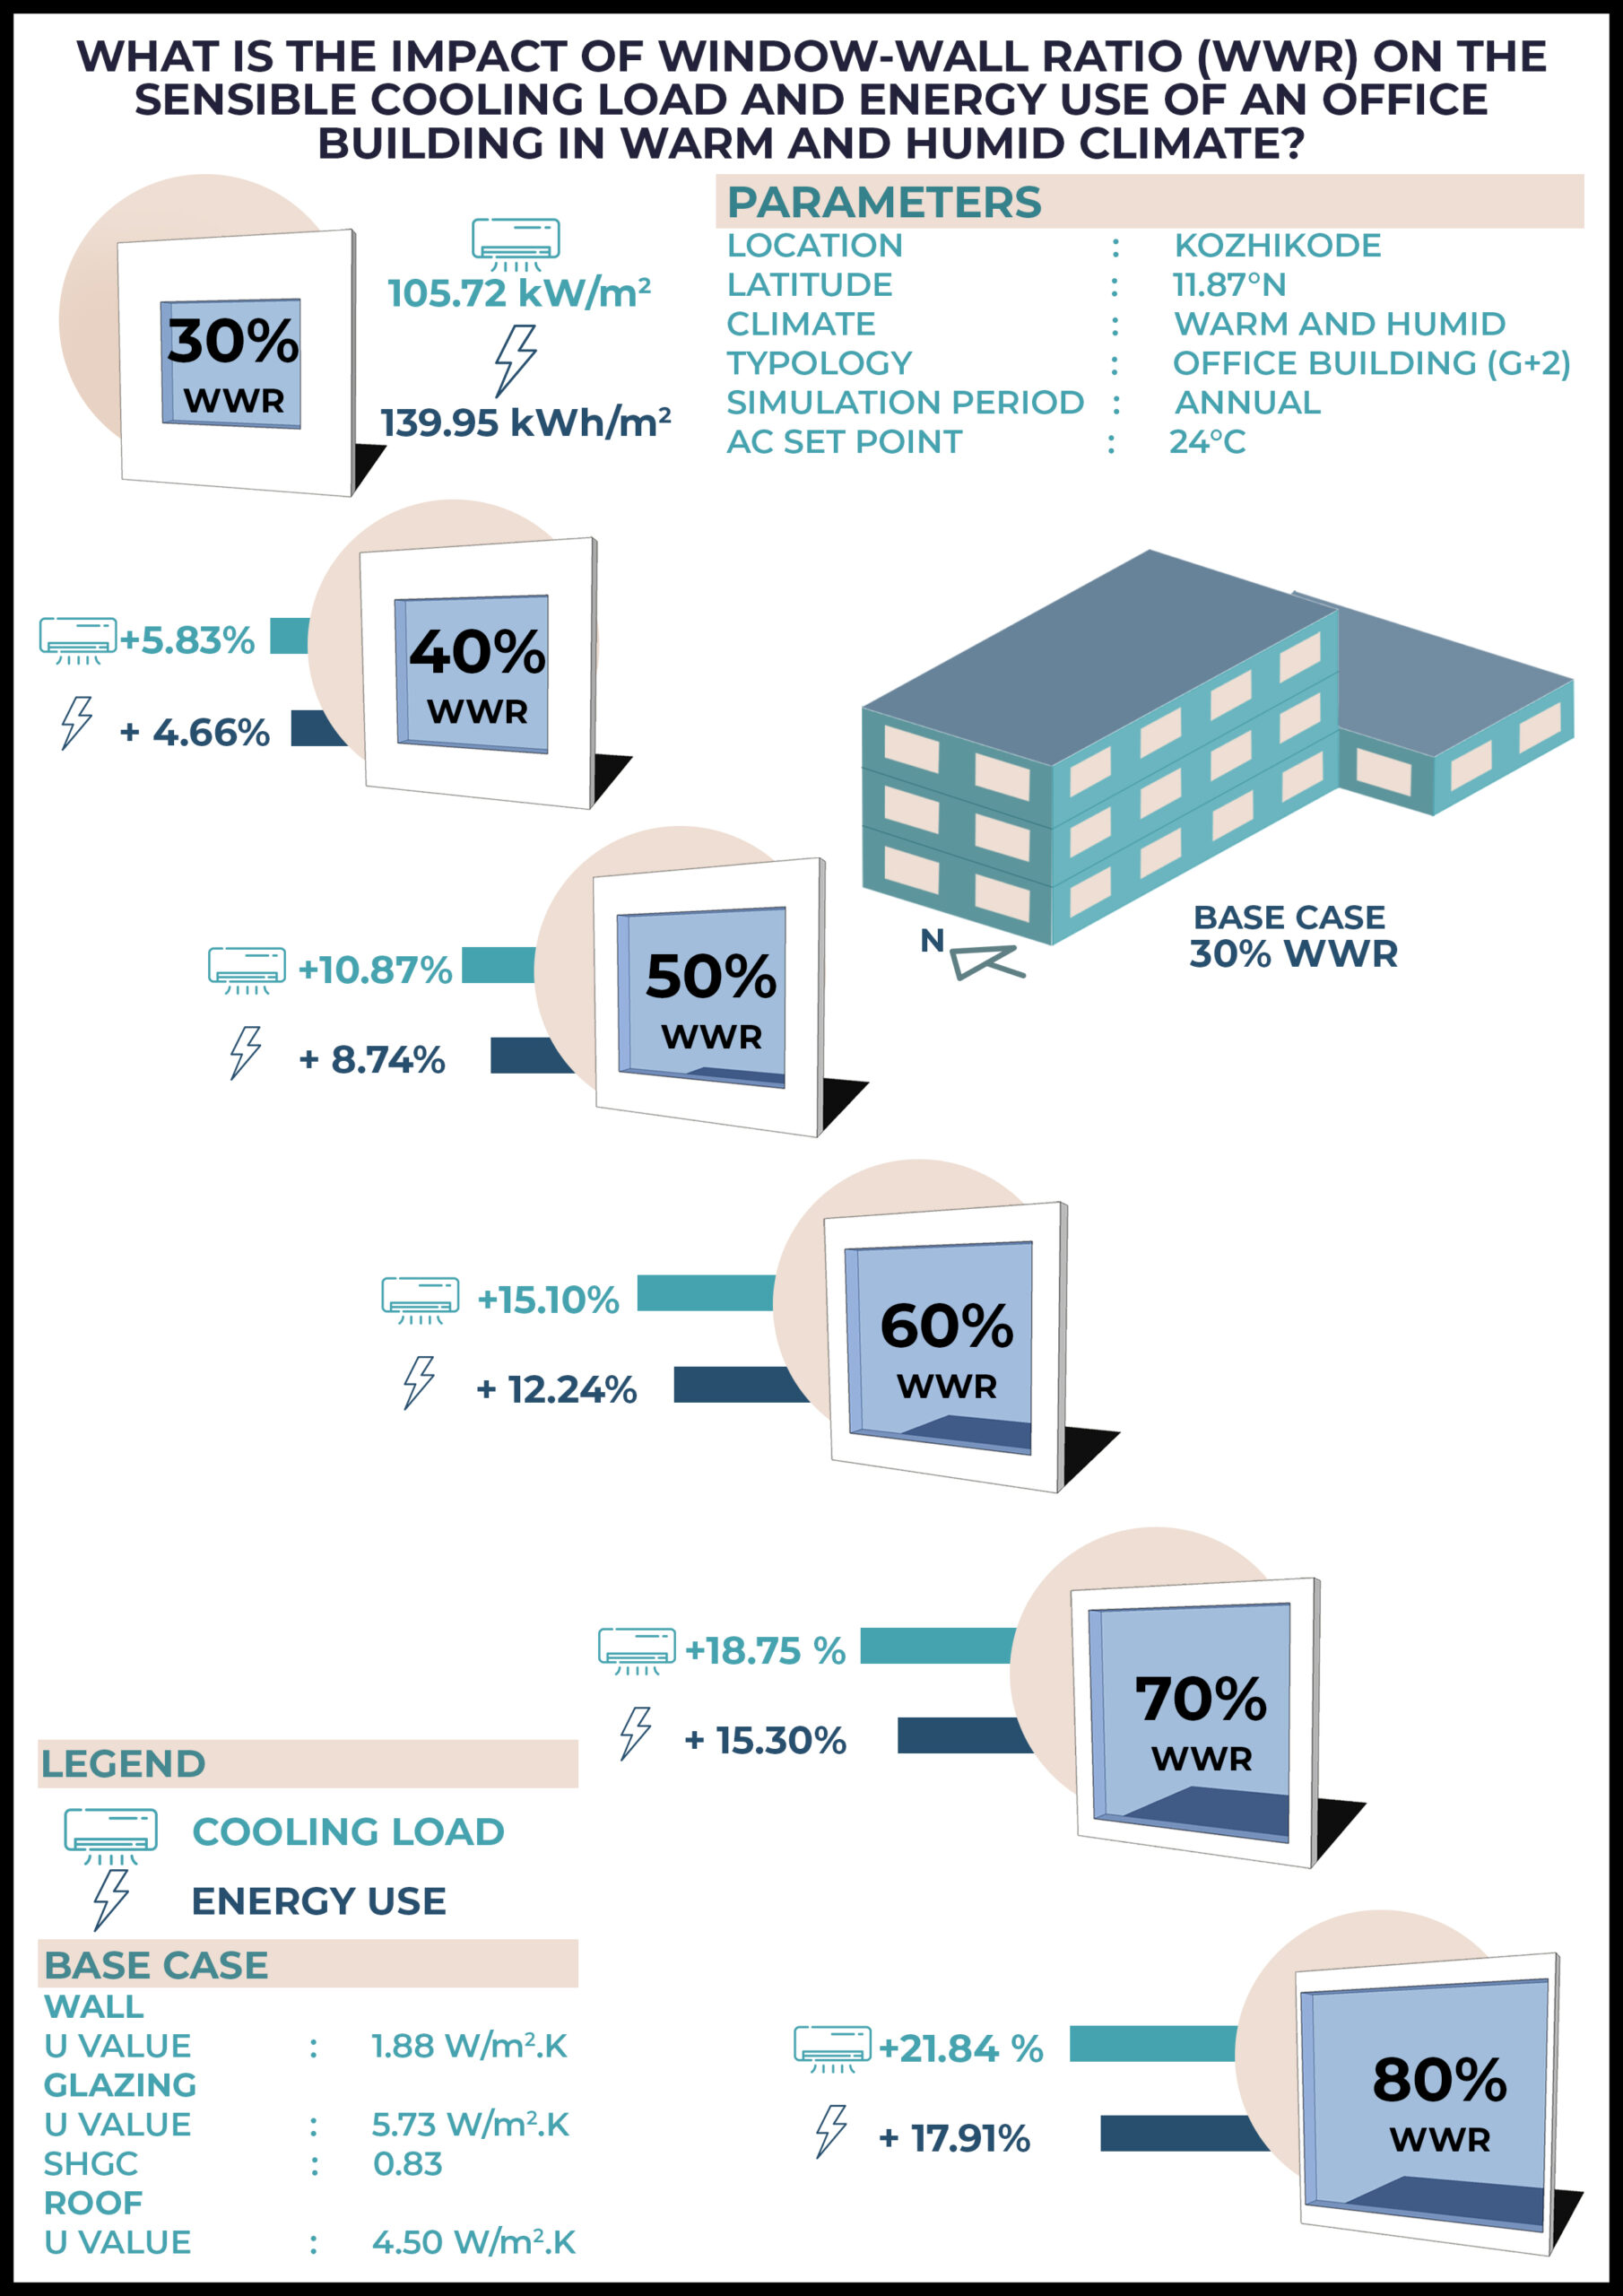
What is this graphic showing? Describe the different parts of the graphic and how it communicates the data.
The graphics illustrate the percentage increase in the Sensible Cooling Loads and Energy Consumption in the office building when only the Window Wall Ratio (WWR) is increased, while the U-value and the SHGC of the glazing are kept constant for each iteration.
What type of graphic is this?
- Diagram
Design Variables
- Glazing Fraction/Window to Wall ratio
Is this part of the ASHRAE-209 cycle?
What tools were used for the simulation analysis?
- Design Builder
- EnergyPlus
- Excel
What tools did you use to create the graphic?
- Adobe Photoshop
What was successful and/or unique about the graphic in how it communicates information?
The graphic comprises bars demonstrating the percentage rise in Sensible Cooling Loads and Energy Consumption as the Window-to-Wall Ratio (WWR) is increased.
Is there anything else you would like to mention?
Included in the competition:

2024 Annual Project StaSIO Challenge - Deadline 03.30.24
January 18, 2024-November 22, 2024