What are the impacts of incremental energy conservative measures on the overall pEUI (kBtu/ft2) toward net zero of an office building located in Menlo Park, California?
Olivier Brouard
Skidmore, Owings, and Merrill LLP
Project Information
Orientation, Location, Weather file, Window-to-wall ratio, Double Glazing, SHGC, VLT, R-Value Wall, Plug Load Density, Dayligthing Sensors, Shading, Light Power Density, HVAC system
Overall predicted Energy Use Intensity (pEUI), Heating, Cooling and Lighting pEUI, solar radiations (kWh/m2)
54000
3C
94111
- Office
SIMULATION PROCESS SECTION
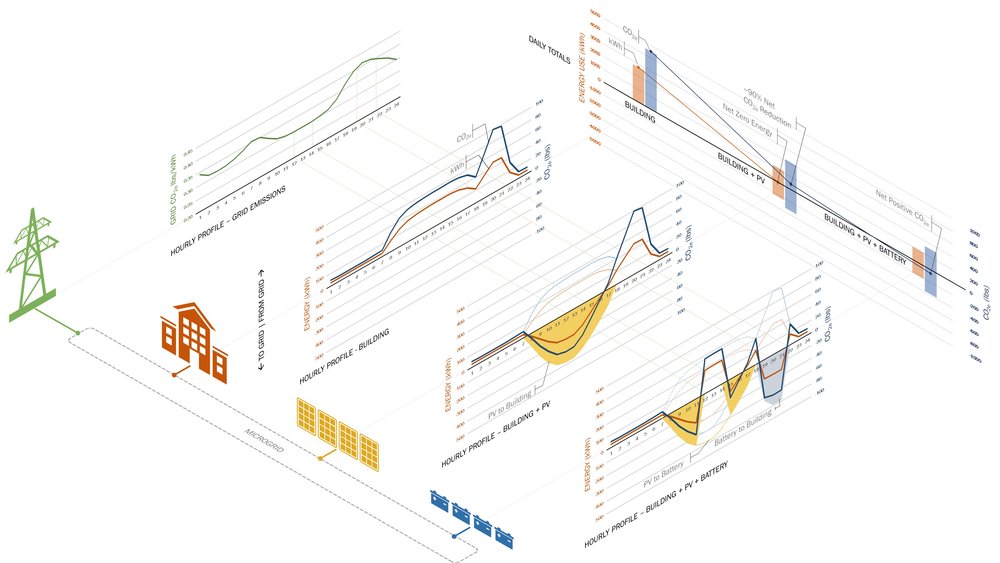
How to get to net-zero using: - passive measures - active measures - on-site renewables
- Architect - Internal Sustainability Personnel
- OpenStudio + Eplus
- Conceptual Design
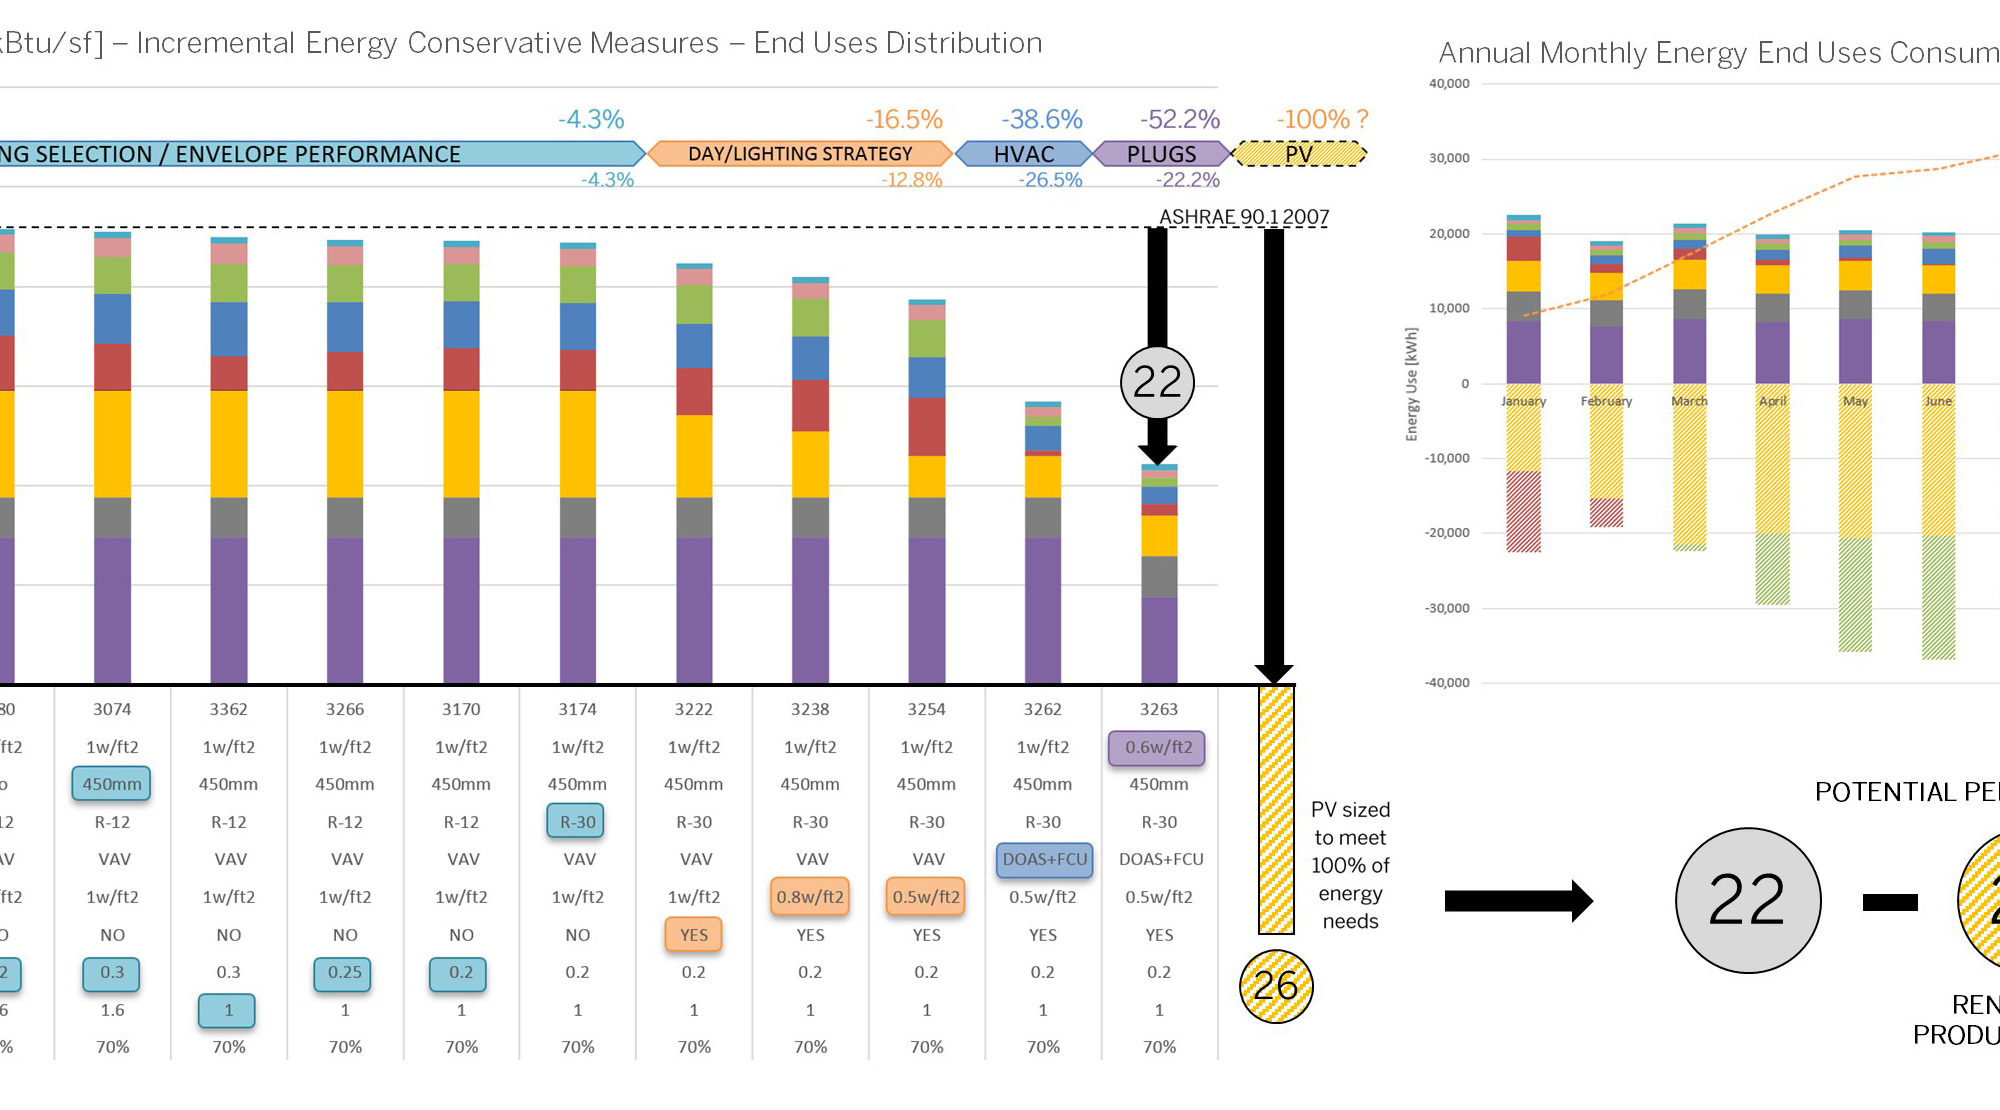
The simulation was integrated as a design kick-off meeting to maximize design performance opportunities . The screenshot below showed the design opportunities (passive measures vs active measures) to understand the contribution of each conservative measures.

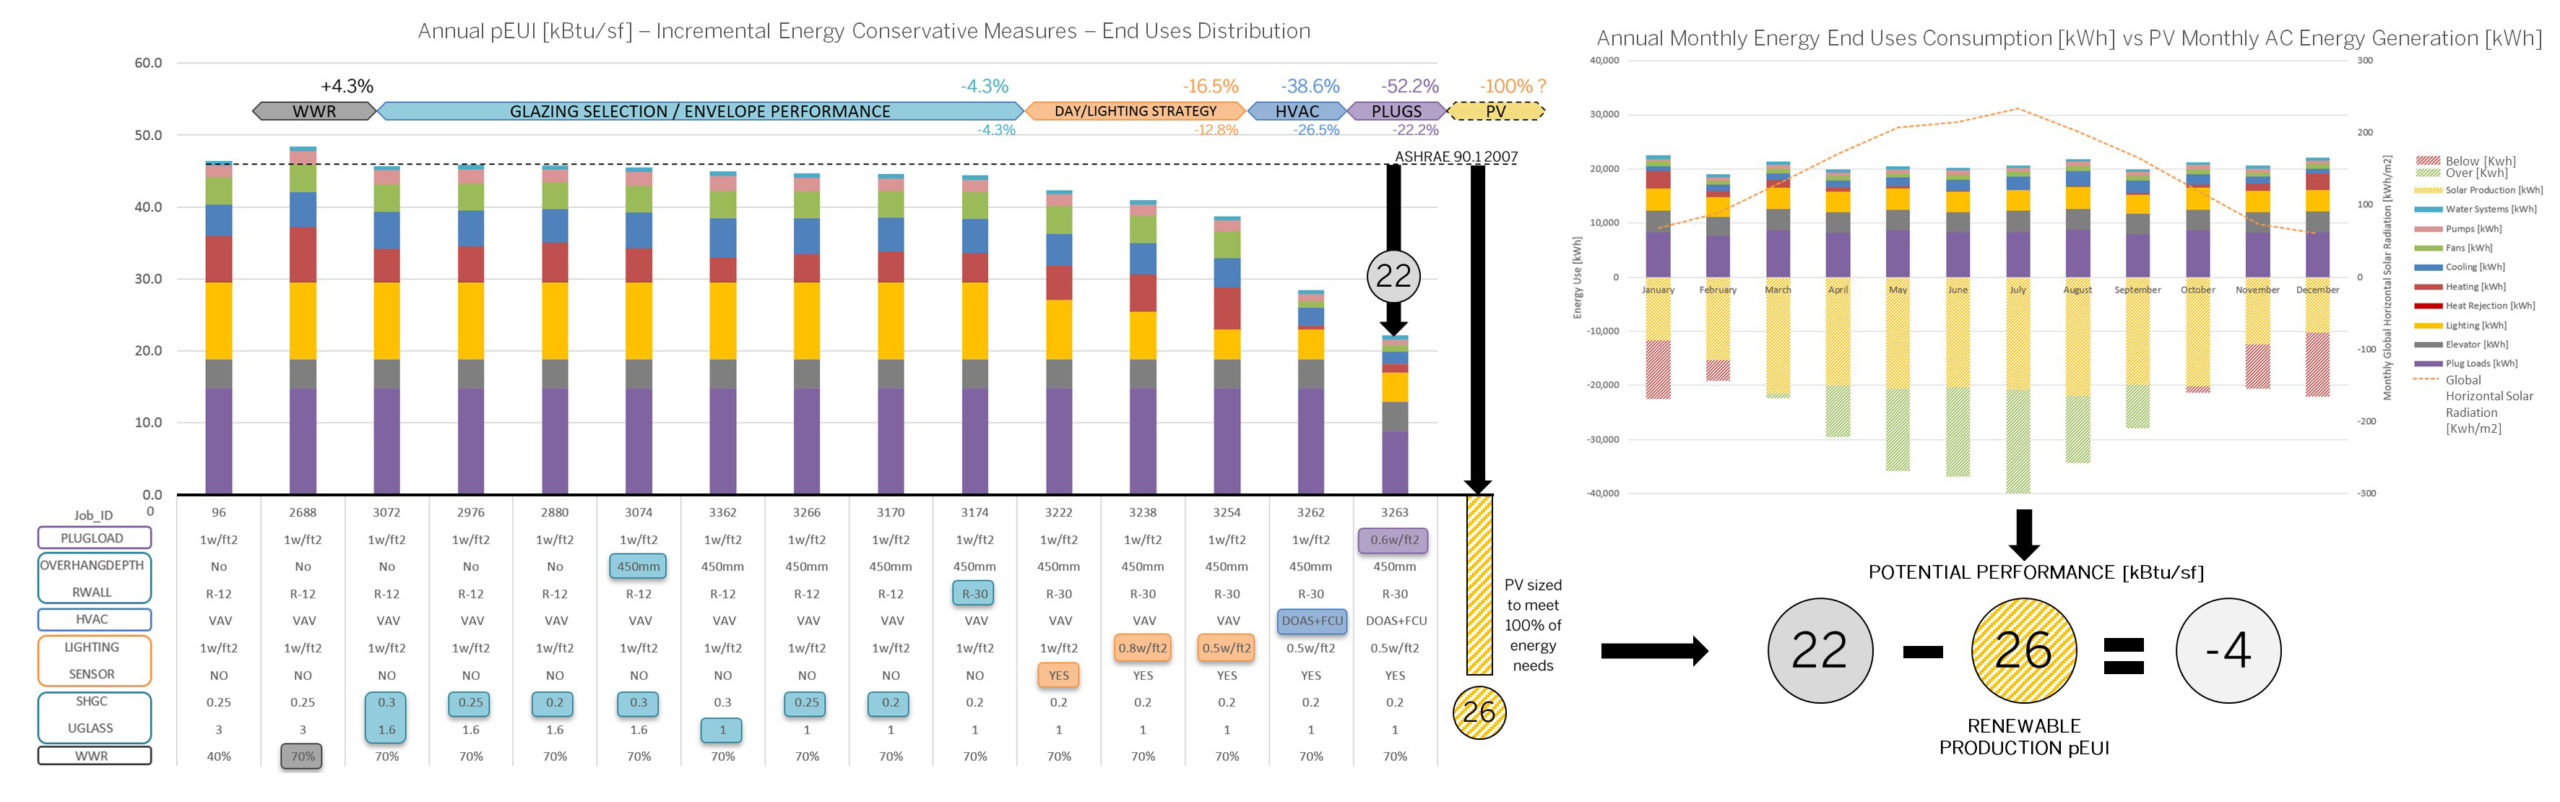
The simulation was set up through an idf file using Energy+ as a simulation engine. Each run was saved and incremented with an additional strategy seeking for energy reduction (ie: glass performance, day lighting strategy, HVAC system selection, plug load reduction and PV renewables)
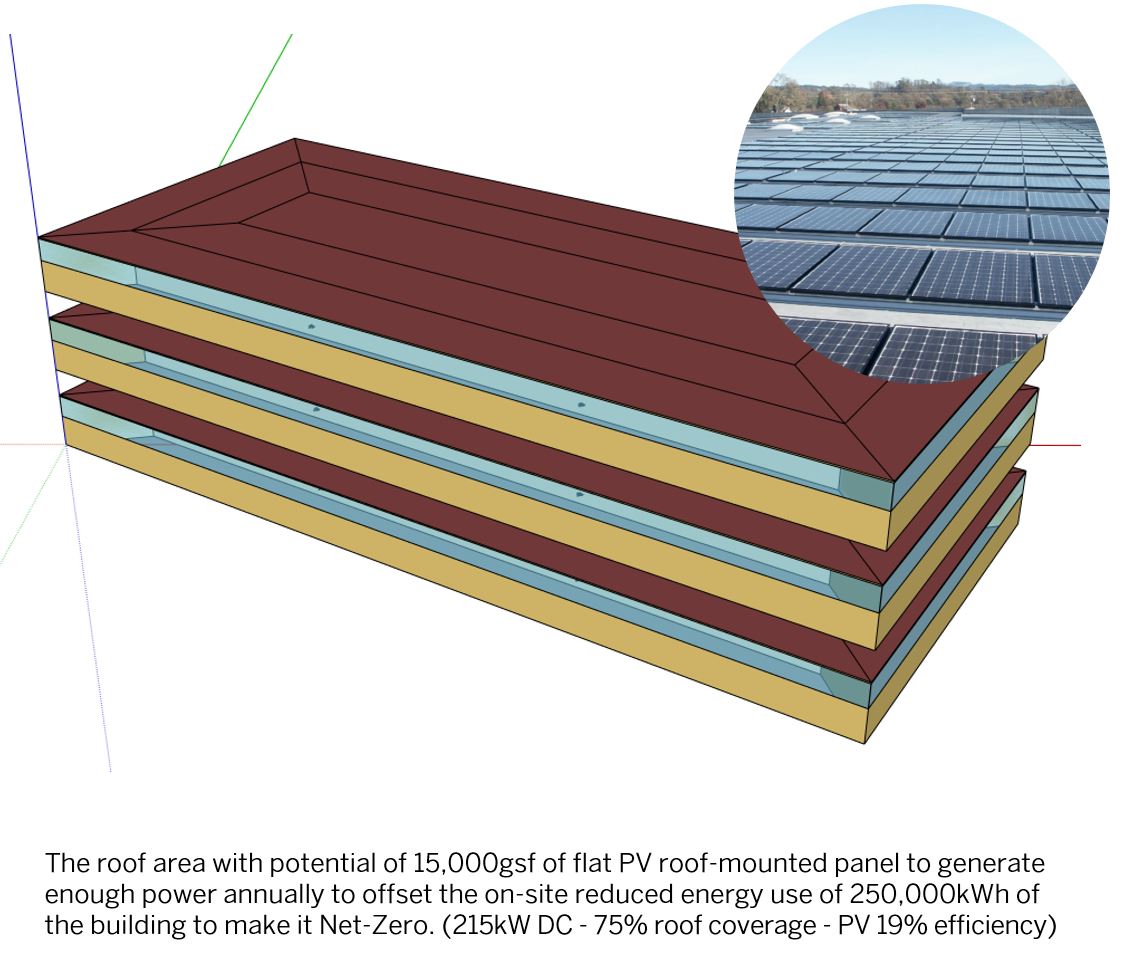
The results were shown on a power point. The unique aspect of the graphic shows at the bottom of the chart laying out each design option changes and showing at the top the % of energy use reduction. The pie diagram informed as a primer that 35% of the pie could directly be influenced by the design itself, whereas 65% would be more influenced by the systems. Once the energy use was reduced to a minimum, the last chart on the bottom right shows how on a month basis PV panels flat mounted on the roof can contribute to electricity-generating with some month producing more than necessary to offset energy consumption, especially the summer month where the sun angle radiations are more vertical. The colder months would naturally have less energy production but overall the project could show a potential of positive energy generation if the roof area was to be maximize with PV coverage up to 75%.