PROJECT INFORMATION
Submitted by: Biwen Sun, Yingjia Wang
Other contributors or acknowledgements: Made Bagus Yudha, Nima Maghzi
ASHRAE Climate Zone: 5A
Building/Space Type: Mixed Use (Office, Lab, Classroom)
Who performed the simulation analysis? University Student
What tools were used for the simulation analysis?
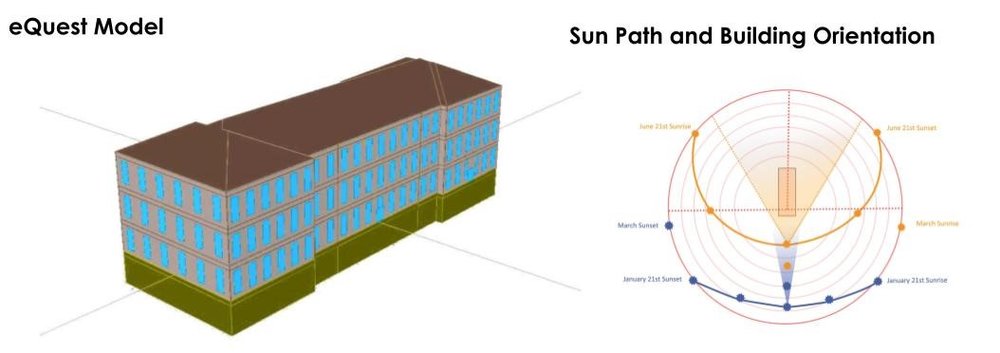
eQuest
Climate Consultant
Grasshopper Ladybug
Grasshopper Honeybee
Computational Fluid Dynamics (CFD)
What tools did you use to create the graphic?
Excel
Adobe Photoshop
What phase of the project was analysis conducted? Post Occupancy
What are the primary inputs of the analysis? Equipment loads
What are the primary outputs of the analysis? Electricity consumption, gas consumption
PROCESS
List the investigations questions that drove your analysis process.
How to build an energy simulation model close to the actual energy consumption of the existing building? Which zone in the building cost most energy? How can we improve the daylight environment in the building? How can we improve the ventilation? What are the possible strategies to improve the performance of the current building? How much energy can be saved possibly?
How was simulation integrated into the overall design process?
The energy simulation is to evaluate the current energy consumption of the building. The result can be used as the reference for the future renovation. The target is intended to cut down about 30% of total energy consumption. To achieve that, several strategies are simulated in the software to improve ventilation, indoor lighting environment, and building envelope performance. Based on the baseline model, improvement strategies are applied as EEM in eQuest, to show how much energy each strategy would possibly save. All the analysis and strategies are presented to the Facilities and Services Department of the University. They gave opinions on whether those strategies are feasible. Then, improvements are modified based on their advice.


How did you set up the simulation analysis and workflow?
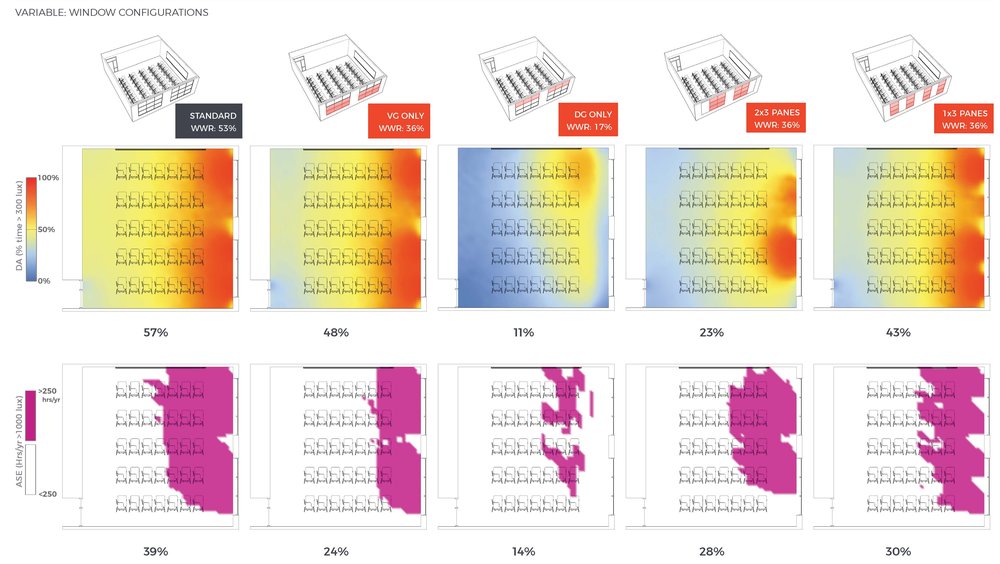
The thermal load and occupancy schedule are generated into graphics through Grasshopper Ladybug and Honeybee. CFD is also a good tool to show the ventilation result in graphics. Other data like total electricity and energy consumption can be transferred into bar charts by using excel. The graphics clearly show the problem area and how much the performance would be possibly improved with the proposed strategies. With the graphics, the audience could understand the process easily and get a direct image of the outcome after renovation.
How did you visualize the results to the design team? What was successful about the graphics that you used to communicate the data?
The thermal load and occupancy schedule are generated into graphics through Grasshopper Ladybug and Honeybee. CFD is also a good tool to show the ventilation result in graphics. Other data like total electricity and energy consumption can be transferred into bar charts by using excel.
Most importantly, what did you learn from the investigation? How did simulation and its outputs influence the design of the project?
The investigation is a great opportunity to know the complexity of the building and understand the depth of involvement required to make accurate building model. Also this process allows us to apply our current knowledge to test the feasibility of design strategies.