PROJECT INFORMATION
Graphic Name: What is the impact of Electrochromic Glazing on thermal comfort and outdoor view vs LowE with manual shades?
Submitted by: Ranojoy Dutta
Firm Name: NA
Other contributors or acknowledgements (optional)
What tools did you use to create the graphic?
-
EnergyPlus
-
Grasshopper
-
Honeybee
-
Excel
What kind of graphic is this? Pie chart, Bar chart, Line plot
Primary Inputs: The inputs for the Predicted Mean Vote analysis are hourly values of surface temperatures, air temperature, radiant temperatures. They were generated by running an annual energy simulation for two glazing options.
Primary Outputs: Predicted Mean Vote; Manual Shade Usage Hours ; EC Tint State Hours
GRAPHIC INFORMATION
What are we looking at?
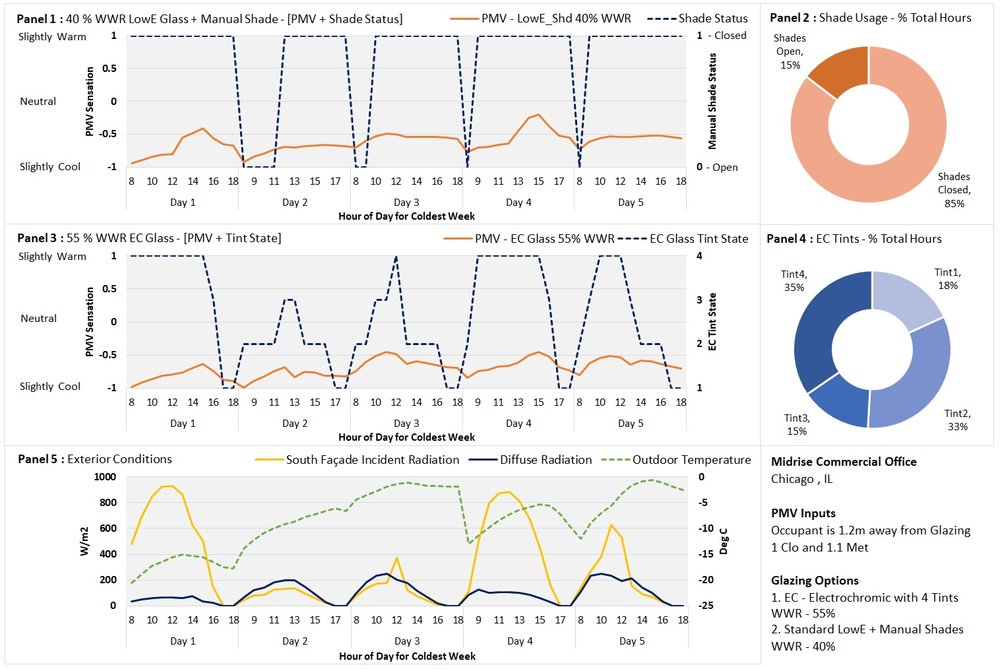
This is a winter thermal comfort analysis for an occupant sitting 1.2 m away from glazing on the south side of a commercial office. The data is recorded from 8 am to 6 pm daily, for the coldest week as per the EPW file fro Chicago, IL. This week represents the effect of intense solar radiation on the south along with the lowest average outdoor air temperature (OAT < -10 ºC).
Due to the low sun altitude (< 30º) in winter whenever there is a clear sunny day the occupants on the south side will experience severe discomfort from glare and overheating even though the OAT is well below 0 C. This condition exists for days 1 & 4 (Panel 5) with high incident radiation throughout the day. As a result, the Electrochromic(EC) glazing stays at Tint 4 (darkest) and the shades are also modeled as fully down. When glare is not a problem EC transitions back to a lighter tint state with higher Tvis and SHGC to allow more daylight as well as passive heating. This is evident for days 3 & 5, where there are only a couple of hours which require darker tints but as the incident radiation levels go down EC selects lighter tint states (Panel 3). On the other hand, once the manual blinds come down they stay down (Panel 4) regardless of improved outside conditions, blocking useful solar gain, reducing daylight and blocking outdoor views for 85% of the hours in that week. On the other hand using predictive controls EC only uses the darkest tint state ( Tint 4) for only 35% of hours (Panel 4), which will reduce daylight for those hours but still maintains full outdoor views.
The primary cause of winter discomfort near windows is inside glass surface temperature, which is dependent on the fenestration U-Value and the OAT. Hence, given the extreme low OAT for the chosen period the PMV is almost always below -0.5 for both glazing scenarios. EC offers comparable winter comfort with substantially more daylight, unobstructed views and greater scope for passive heating. The improvement in U-value from shading devices is minimal unless a relatively air-tight seal is made between the shade and window frame (e.g., with a track). Hence despite the shades being down for most of the time the PMV is only marginally better than VDG, but still mostly below -0.5.
How did you make the graphic?
A commercially available EC product was modeled with 4 tints using the Energy Management System (EMS) feature within Energy Plus v8.9 to replicate the exact manufacturer specified multi-criteria control algorithm . Outputs from this multi-state model were used for thermal comfort analysis using Honeybee. PMV results were then analyzed in Excel. Hourly values for EC Tint states and manual shade status (Up/down) was extracted from the energy plus models and add to the graphic in excel.
What specific investigation questions led to the production of this graphic?
-
This study was aimed at evaluating occupant comfort and access to outdoor views by increasing window wall ratio (WWR) with EC glazing to 55% for a commercial office in Chicago vs a 40% WWR with standard Low-E glazing with manual shades. The 55 % WWR for EC was determined by annual energy and peak HVAC analysis.
How does this graphic fit into the larger design investigations and what did you learn from producing the graphic?
This study found that the WWR for a mid-rise office could be increased by 25 – 50% with EC without any HVAC or energy penalty across three distinct climate zones. This translated to significantly higher daylight, greater viewing area and full glare control with year-round outdoor views vs LowE_Shd at 40% WWR. This specific graphic showed that while EC might have marginally more winter discomfort under very low outdoor temperatures it still provides unobstructed views and greater scope for passive heating and daylight in winter. The winter discomfort can be rectified by selecting a lower U-Value.
What was successful and/or unique about the graphic in how it communicates information?
This graphic shows the impact of manual shades staying down regardless of changing outdoor conditions, resulting in blocked view and daylight. The EC glazing however automatically tracks the outside solar conditions ( sun angles and intensity )to chose an appropriate tint state. The outdoor conditions chart show that despite subzero temperatures the incident solar radiation is still very high with a potential for discomfort from overheating and glare unless shades are fully down or EC is in its darkest state. However unlike manual shades EC never blocks outdoor views.
What would you have done differently with the graphic if you had more time/fee?
I would have liked to make this a web based graphic such that a user could adjust the date period from one week to one month or even a year. Also it would be nice to look at the other façade orientations and other cities. I had all the data but could not present it all due to lack of time.