PROJECT INFORMATION
Graphic Name: What is the impact of orientation and WWR on the energy use?
Submitted by:
Firm Name:
Other contributors or acknowledgements (optional)
What tools did you use to create the graphic?
-
Sefaira
-
Excel
What kind of graphic is this?
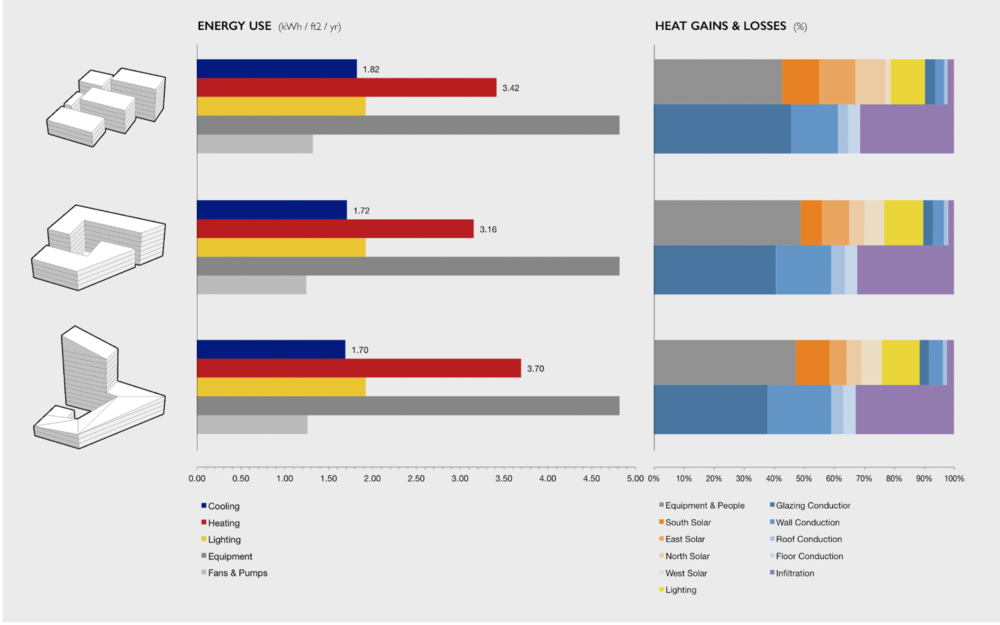
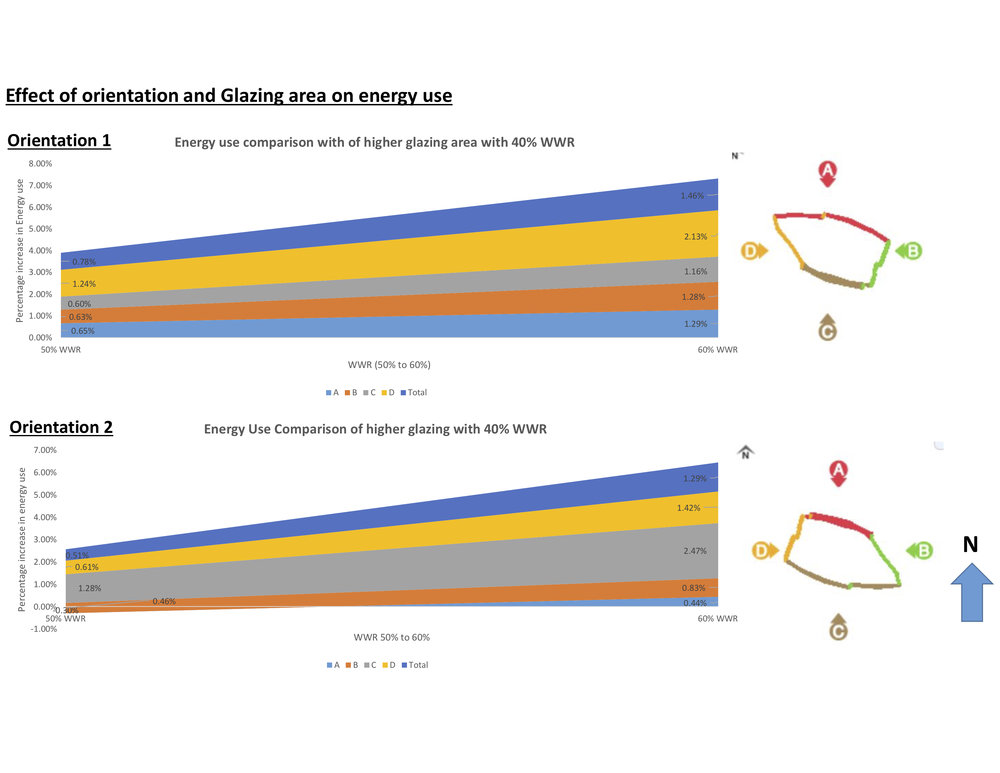
Primary Inputs: Energy use comparison of higher glazing area with 40% WWR
Primary Outputs: Percentage increase in energy use
GRAPHIC INFORMATION
What are we looking at?
The graphic compares 2 orientations with different WWRs for the building. The baseline for both orientations is 40% WWR. The graphic compares the effect of increasing the WWR between 50% to 60% for all the facades. Given the higher glazing area in the 'triangular section' Facade D moves the needle on energy use in Orientation 1. However reorienting the building may help in reducing energy use while maintaining the same glazing area in the 'triangular section'.
How did you make the graphic?
Exported all the cases to excel and post processed it
What specific investigation questions led to the production of this graphic?
1) What is the effect of the orientation, given the higher glazing area n certain facades?
2) What is the effect of reducing the glazing area?
3) What is the effect of reorienting the building
4) What is the effect of various combinations of WWR with different orientations?
How does this graphic fit into the larger design investigations and what did you learn from producing the graphic?
Optimizing the facade, interior layout, circulation and other aspects of the architectural design would be affected by the orientation and the WWR.
What was successful and/or unique about the graphic in how it communicates information?
Stacked graph with 2 different scenarios quickly says which is the ' problematic facade in each of the cases.
What would you have done differently with the graphic if you had more time/fee?
Daylight or glare anaysis