PROJECT INFORMATION
Graphic Name: What is the impact of a wind channel on natural ventilation performance?
Submitted by: Jeehwan Lee
Firm Name: Hampton University
Other contributors or acknowledgements (optional) Jonathan Legaspi
What tools did you use to create the graphic?
-
FloVENT
What kind of graphic is this? Heat map
Primary Inputs: Wind velocity
Primary Outputs: Natural ventilation potential
GRAPHIC INFORMATION
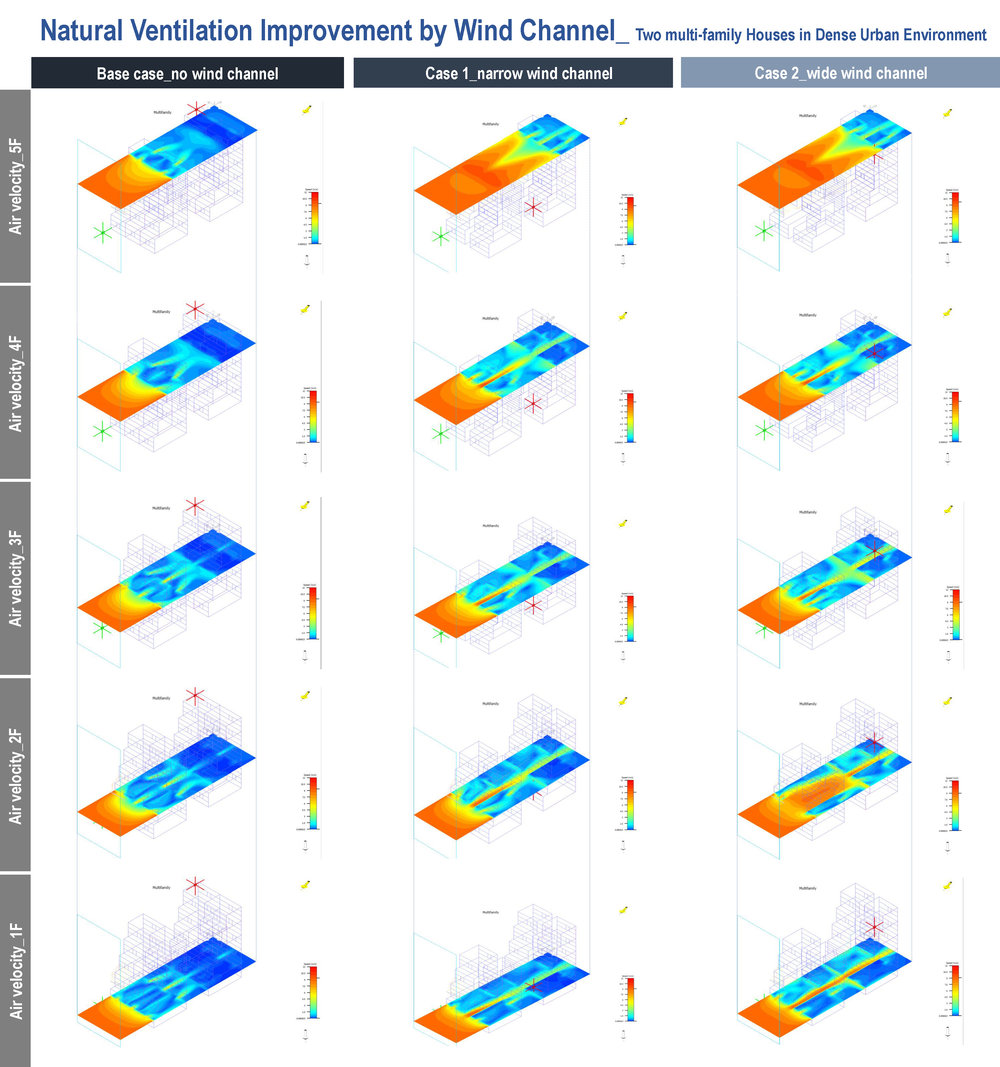
What are we looking at?
Wind velocity and patterns depending the level of density of multi-family housing in a dense urban environment.
How did you make the graphic?
First, Revit graphic tool generates a multi-family housing where the city is very congested. This study aims to investigate to potential natural ventilation application to a compact building block. The computational fluid dynamic (CFD) simulation generated the same design of Revit to predict air behaviors based on a number of boundary conditions such as temperature, wind velocity, and so forth.
What specific investigation questions led to the production of this graphic?
Due to accelerated urban population growth and energy consumption by buildings, this simulation study is designed to explore an alternative way to promote natural ventilation performance in dense urban environment for better indoor air quality and energy saving by suggesting a wind channel in a compact building block.
How does this graphic fit into the larger design investigations and what did you learn from producing the graphic?
Simulation study showed the potential for the future development of site design and urban planning, considering an alternative application of outdoor natural ventilation to building occupants comfort. Based on CFD simulation outcomes, this study implies how to not only predict wind patterns through a wind channel of a compact building block, but also control wind velocity for comfort levels of natural ventilation for building occupants.
What was successful and/or unique about the graphic in how it communicates information?
It is very complicated and long process to predict numerical natural ventilation performance by a wide range of different cases at a time. In this CFD simulation, minor changes of the width of a wind channel showed the different results related to wind patterns and velocity, considering environmental impact. From this fining, it turns out that simulation tools for a quantitative study is very useful, informative, numerical, and faster to evaluate air behaviors for indoor air quality and natural ventilation performance.
What would you have done differently with the graphic if you had more time/fee?
It would be fantastic to predict and visualize wind behaviors in urban settings because wind patterns are so unpredictable to measure the level of natural ventilation performance and thermal comfort. If there is more time and resources available, thus, I would like to simulate indoor air behaviors to understand indoor temperature distributions in relation to indoor air quality and energy simulation.