PROJECT INFORMATION
Graphic Name: What’s the impact of shading devices on visual comfort?
Submitted by: Jeehwan Lee
Firm Name: Hampton University
Other contributors or acknowledgements (optional):
What tools did you use to create the graphic?
-
Sefaira
What kind of graphic is this? Heat Map
Primary Inputs: Shapes and opening ways of shading devices
Primary Outputs: Daylight Factor
GRAPHIC INFORMATION
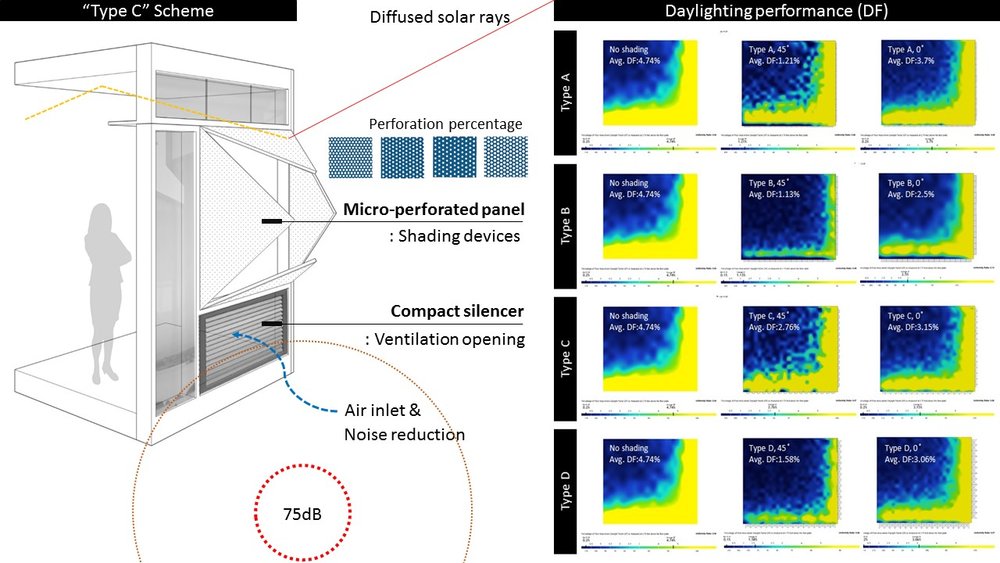
What are we looking at?
Daylight factor depending on various shapes and opening ways of shading devices.
How did you make the graphic?
First, SketchUp graphic tool generates a hypothetical indoor space with diverse patterns of ventilation openings facing East and South direction. Ventilation openings are designed to orient at a 0 degree angle and 45 degree angle. Sefaira energy modeling software enabled to visualize daylight performance depending on a certain date, annual, and daylight factor (DF). In Sefaira, daylighting performance for visual comfort was simulated based on various shapes and opening ways of shading devices.
What specific investigation questions led to the production of this graphic?
This simulation study explores a multifunctional shading device considering daylight harvesting, natural ventilation performance, and noise reduction. Studies have shown exterior shading systems to be a cost effective way of lowering cooling energy by reducing direct solar gain through windows while also reducing glare in interior spaces. Micro-perforated acoustic louvers are designed to decrease the potential glare as well as noise transmission loss in the dense urban environments.
How does this graphic fit into the larger design investigations and what did you learn from producing the graphic?
Simulation study showed the potential for the future development of a modular building façade system, contributing to the passive and active controls of the heat, glare, air, and noise. Based on type, size, shape, opening way, operation, and material of shading devices, the level of daylighting performance implies the potential ways of sustainable building façade design for better indoor environmental quality.
What was successful and/or unique about the graphic in how it communicates information?
It is very complicated and long process to predict numerical daylighting performance by a wide range of different cases at a time. In this simulation, minor changes of acoustic louver orientations showed the different results, considering environmental impact. The outcomes give implications what type and orientation of shading louvers can achieve proper level of illuminance for visual comfort. From this fining, it turns out that simulation tools for a quantitative study is very useful, informative, numerical, and faster to evaluate building performance before the experimental study.
What would you have done differently with the graphic if you had more time/fee?
It would be fantastic to predict and visualize daylight performance, air behaviors, and noise transmission simultaneously on the same simulation platform. Each simulation software optimized for solar rays, air movement, and sound propagation should be integrated or collaborated for more comprehensive and cohesive outcomes. If there is more time and resources available, thus, I would like to simulated air behaviors and noise transmission together to understand comprehensive building façade performance base on the same scenarios conducted for daylight performance.