PROJECT INFORMATION
Graphic Name: What are the impacts of interconnected design decisions on achievable performance levels?
Submitted by: Melissa Kelly
Firm Name: WSP Built Ecology
Other contributors or acknowledgements (optional)
What tools did you use to create the graphic?
-
EnergyPlus
-
Excel
-
Adobe Photoshop
What kind of graphic is this? Scatter Plot
Primary Inputs: Insulation level, interior lighting levels, HVAC efficiency, glazing U-value and SHGC, and service hot water loads
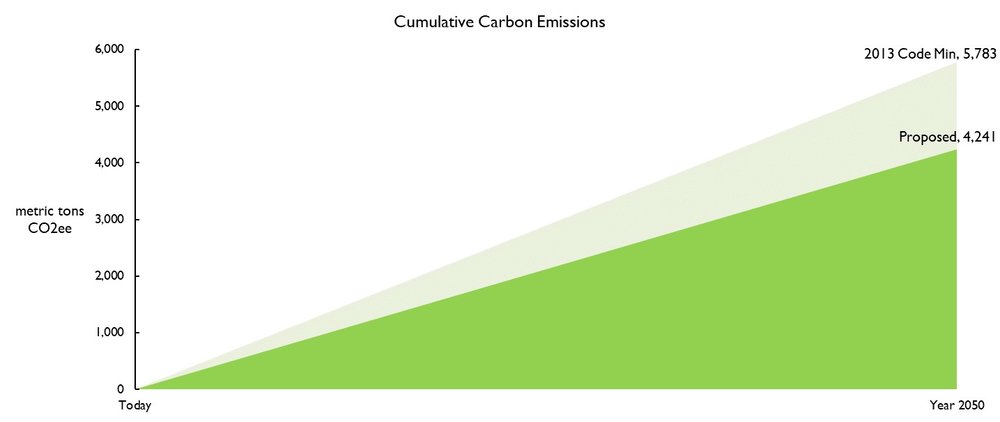
Primary Outputs: Emissions in mt CO2e/a
GRAPHIC INFORMATION
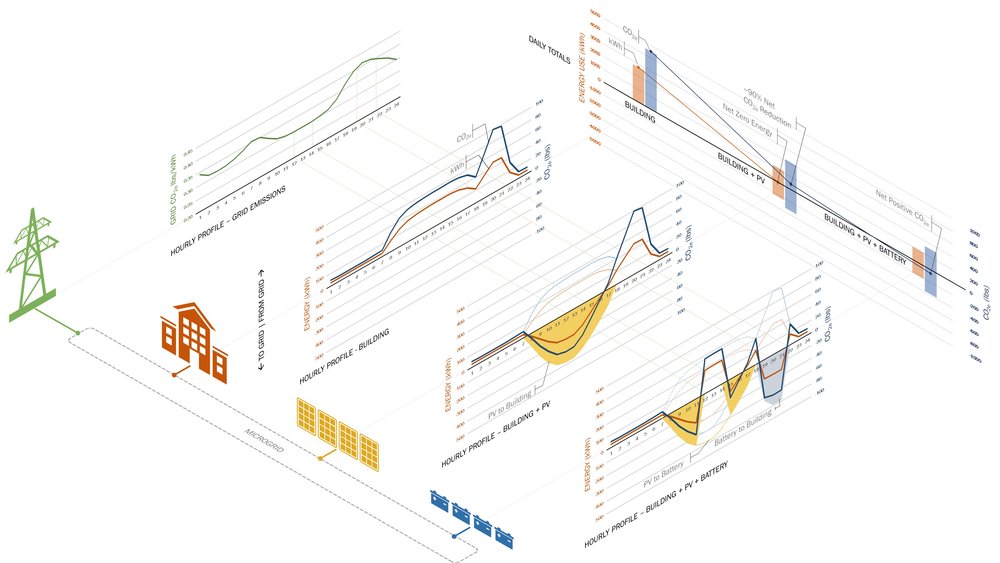
What are we looking at?
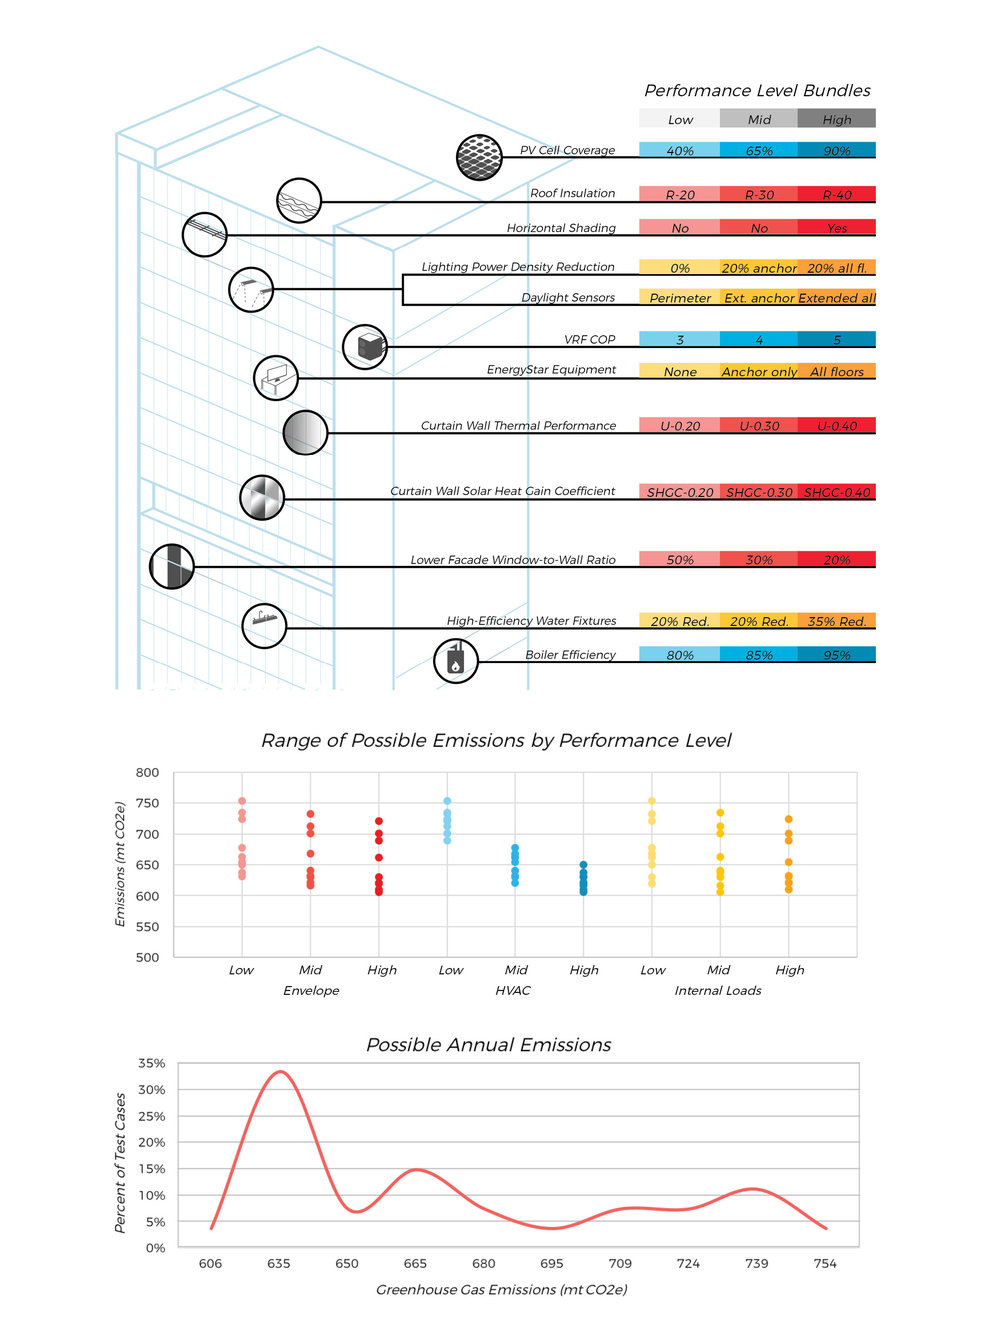
This graphic is intended to present schematic whole-building energy modeling results through a probabilistic lens. The graphic is in three parts, each of which steps out to a more generalized scale. The first part of the graphic describes the inputs for each parameter, which were bundled into “low,” “medium,” and “high” performance levels for envelope, HVAC, and interior loads. I would normally provide this in a table, but I wanted to create an illustration that tied the parameters visually to the building and make the numbers more meaningful. Each of these bundles were cross-referenced with the others to create a series of test cases. The second part of the graphic is a scatter plot presenting the range of resulting annual emissions if each bundle is held constant, so that the relative impact of each can be examined. For example, the first column of data represents all possible outcomes if a low-performing envelope system is selected. The third part is a frequency analysis distribution showing how many test cases fell within a certain range of annual emissions. The peaks show where the building’s performance level is likely to end up within the range of possible decisions assessed.
How did you make the graphic?
Energy model results were extracted and post-processed in Excel, and the illustration was created in Photoshop.
What specific investigation questions led to the production of this graphic?
The goal was to confirm the building’s achievable performance level and understand which parameters needed attention in order to achieve those levels.
How does this graphic fit into the larger design investigations and what did you learn from producing the graphic?
My own goal was to reflect that in early analysis we’re really looking at a sample of possibilities, and to work with that ambiguity knowing that the design will shift over time. I was curious about how this work could be presented holistically and how that would differ from looking at ECMs individually.
One surprising thing that I might have only noticed from the frequency analysis is that the building’s possible performance doesn’t have a linear relationship with the performance levels of the bundles. I generally expected that the more mid- and high-level bundles added the better, but in fact I found it was often more advantageous to have a balanced performance level across all three systems, which is why the graph’s peak is on the low end of the range rather than in the middle.
What was successful and/or unique about the graphic in how it communicates information?
The relationship between the scatter plot and frequency plot create an interesting dialogue—the scatter plot shows which areas reduce future risk or can always bring performance improvements, while the frequency plot shows that there are multiple pathways to almost every outcome. Having results which are cross-referenced across multiple disciplines also reinforces the need for an integrated design approach in order to achieve success.
What would you have done differently with the graphic if you had more time/fee?
I would have liked to have find a way to identify the test cases that fall under each range for the frequency plot. It’s easy to do that in an interactive diagram where you can choose to limit or highlight particular cases, but on a static image there’s just not that much room. With more time and computational power, this approach could also be enhanced if individual ECMs were cross-referenced rather than bundles.