PROJECT INFORMATION
Graphic Name: What is the impact of Microgrids on Greenhouse Gas Emissions?
Submitted by: Shreshth Nagpal
Firm Name: MIT Sustainable Design Lab
Other contributors or acknowledgements (optional)
What tools did you use to create the graphic?
-
eQuest
-
EnergyPlus
-
Excel
What kind of graphic is this? Comparison
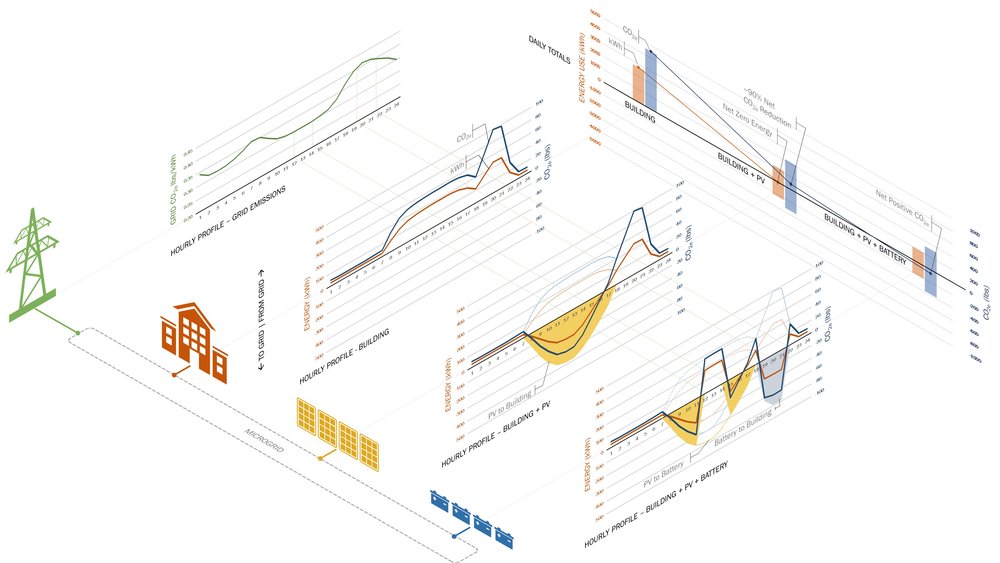
Primary Inputs: Simulation results for building houly load profiles by energy end-use for an institutional project in CA; capacities and dispatch sequences for various studied energy generation, and storage systems, and grid hourly greenhouse gas emissions factors
Primary Outputs: Using annual average daily profiles to illustrate, the graphic presents how an optimal configuration of energy generation and storage systems, including capacities and dispatch sequences, can help reduce grid related greenhouse gas emissions
GRAPHIC INFORMATION
What are we looking at?
Step by step reduction in energy and carbon emissions as microgrid components are incrementally added for optimized operation.
How did you make the graphic?
Charted numerical data output in excel.
What specific investigation questions led to the production of this graphic?
How can microgrids be optimized to achieve a carbon neutral operation?
How does this graphic fit into the larger design investigations and what did you learn from producing the graphic?
Assess optimal operating profiles for renewable energy generation, storage and reuse profiles to achieve carbon neutral operation.
What was successful and/or unique about the graphic in how it communicates information?
Series of design steps are explored and their impact presented in a single graphic.
What would you have done differently with the graphic if you had more time/fee?
Vector graphics instead of raster images that resulted in a serious loss of resolution.