PROJECT INFORMATION
Submitted by: Amir Rezaei
Firm Name: CannonDesign
ASHRAE Climate Zone: 5A
Building/Space Type: Office
Who performed the simulation analysis? High Performance Building Analyst
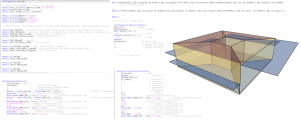
What tools were used for the simulation analysis?
-
EnergyPlus
-
jEplus+EA + PowerBI
What tools did you use to create the graphic?
-
OpenStudio
-
PowerBI
What phase of the project was analysis conducted? Conceptual Design, Schematic Design
What are the primary inputs of the analysis? Envelope thermal properties, window-wall ratios, zone HVAC type, AHU coil types, boiler/chiller sizes
What are the primary outputs of the analysis? EUI, Energy cost, Construction cost
PROCESS
List the investigations questions that drove your analysis process.
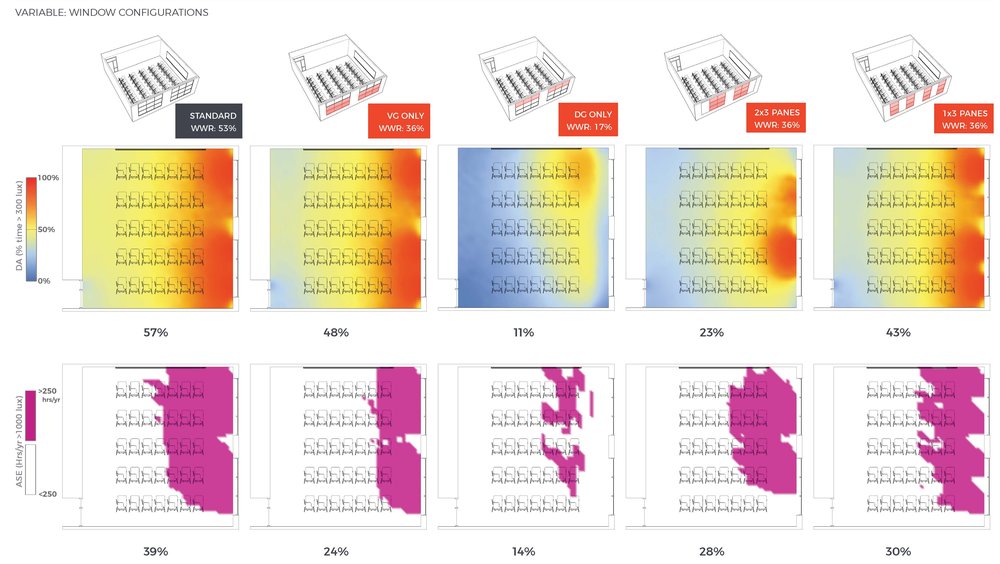
Designing an office in a specific climate (Buffalo, NY), I want to know what are most economical energy conservation measures either architecturally or mechanically? What are the impact of different WWRs on different facades on the mechanical system sizes? How does the envelope thermal properties affect the overall building energy use and construction costs? How much energy savings can I achieve using a more efficient HVAC system for my building? I only need ballpark numbers for early stages of design! Should I spend more money on more insulation or upgrade to a more efficient HVAC system?
How was simulation integrated into the overall design process?
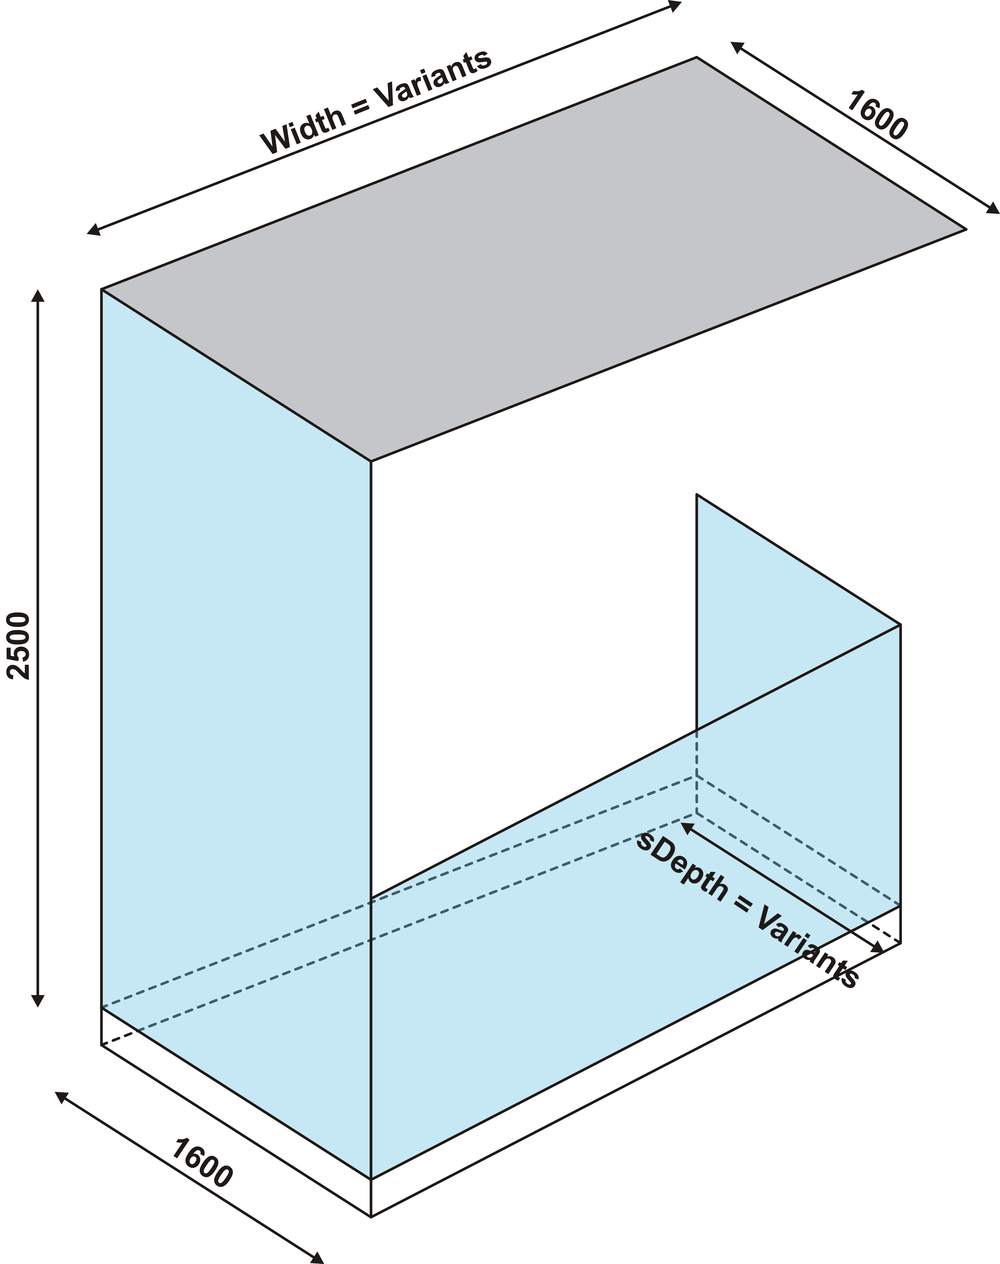
A fully parametrized shoebox model was created in Energyplus with EPMacro capabilities and connected to the optimization engine JEPlus+EA. A large number of architectural and mechanical equipment were modeled and the goal was to look at the combination of different variables that land the project on the intersection of low energy/cost and construction cost.
The visualized results were used at the onset of the project to come up with the ballpark WWR and envelope properties that the architect took responsibility to design to. The results were also used to quantify the ballpark range of EUI and energy cost associated with different AHU and zone HVAC systems, i.e. the impact of having a plant loop versus gas/DX/electrical solutions. The inputs to the simulations also has construction cost associated with all the design variables including amount and type of insulation, glazing properties, HVAC system type, chiller/boiler size, etc. so that the energy implications of design decisions can be looked at in conjunction with the building construction cost implications.
How did you set up the simulation analysis and workflow?
1) Fully parametrized a shoebox model that can look at multiple combination of different design inputs. 2) Connected that parametrized model to JEPlus+EA 3) Simulated overnight for a few thousand simulations 4) Collected the data from simulations and post-processed the data in PowerBi to make the data interactive and digestible

How did you visualize the results to the design team? What was successful about the graphics that you used to communicate the data?
Using PowerBi. Interactive nature of data was successful. The interactive data started conversations among team members on what strategies were most economical depending on other elements of design. The results showed how each design elements's performance is truly dependent on the previous one. For example, the optimized WWR conversation and how that impacts the size of central plant equipment that in turn drives the overall cost of the HVAC solutions and how those two are interdependent based on the thermal performance of glazing and other envelope properties.
Most importantly, what did you learn from the investigation? How did simulation and its outputs influence the design of the project?
1. Learnt that building science concepts are best discussed with data when multiple stakeholders at the table.
2. The large datasets can be confusing but with the expert at the table to navigate the data the design direction can significantly be influenced and maybe changed!
3. Not everyone is ready for large data shock and it takes time to get used to this way of approaching design.
4. Was able to demonstrate how even with a traditional mechanical system it is possible to deliver high performance office projects with more investment in the envelope solutions.
5. Users could click on different points (hold SHIFT to select multiple design points) or filter the parallel coordinate graphs to compare the results early in the design process. This was done as a case study for office spaces with Buffalo, NY climatic data and the plan is to perform similar simulations for different climatic conditions and building typologies to have the EUI and energy cost numbers ready for every project we design in major climates we design for!