PROJECT INFORMATION
Submitted by: Ken Takahashi – Energy Modeler
Firm Name: Integral Group
Other contributors or acknowledgements: Michael Martinez
ASHRAE Climate Zone: 3C
Building/Space Type: Office
Who performed the simulation analysis? MEP Firm, External Energy Consultant
What tools were used for the simulation analysis?
OpenStudio + Eplus
EnergyPlus
Grasshopper Ladybug
Grasshopper Honeybee
What tools did you use to create the graphic?
Adobe Photoshop
Grasshopper Honeybee
Adobe Indesign
Adobe Illustrator
What phase of the project was analysis conducted? Construction Documentation
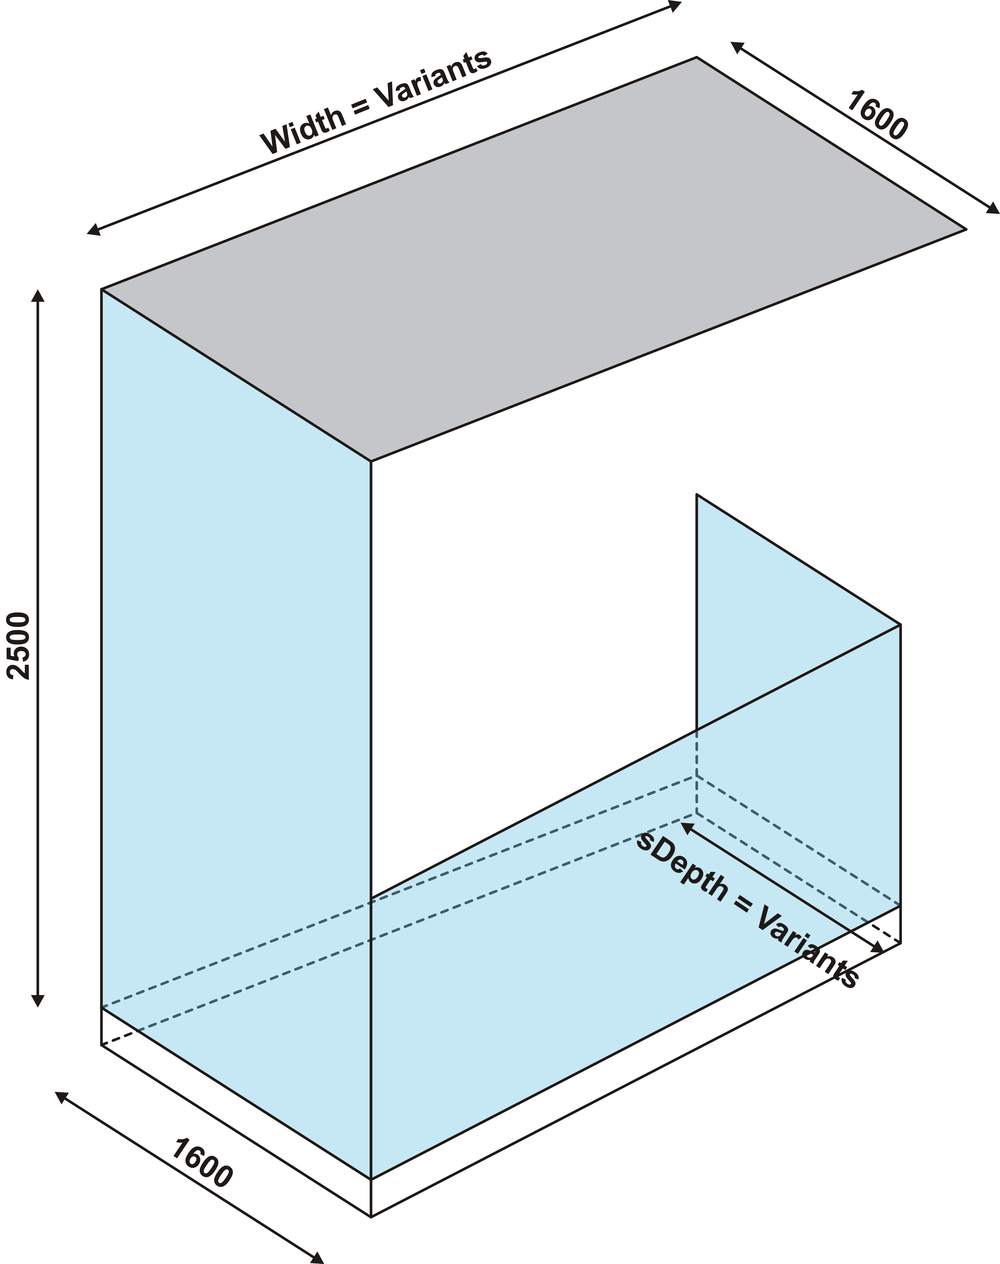
What are the primary inputs of the analysis? Glazing, Lobby Geometry, Surrounding Buildings, HVAC system, Finishes
What are the primary outputs of the analysis? Comfort, Surface Temperature, Microclimate Analysis
PROCESS
List the investigations questions that drove your analysis process.
Is low-e glazing necessary in order to maintain lobby comfort in a well shaded urban environment? Can the glazing be replaced with cheaper laminated glazing while still maintaining a comfortable lobby throughout the year?
How was simulation integrated into the overall design process?
This analysis was done late in the design process because the architect wanted a second option from a different MEP/energy consultant firm. The design was mostly complete at this point but the VE process put the expensive insulated glazing unit into question for the ground level lobby surrounded by neighboring tall buildings. The team was hired to investigate different glazing options and see the impact on comfort for select days and for the entire year.
First, a 180° fisheye photo was taken from the site where the lobby glazing will be located. Then a sun path diagram of the site was overlaid onto fisheye photo. This way, the design team can identify when the sun will hit the lobby and when it will be shaded by neighboring buildings. This was compared the the Rhino model of the site provided by the architect and compared with their shading analysis to verify the validity of the geometry.

How did you set up the simulation analysis and workflow?
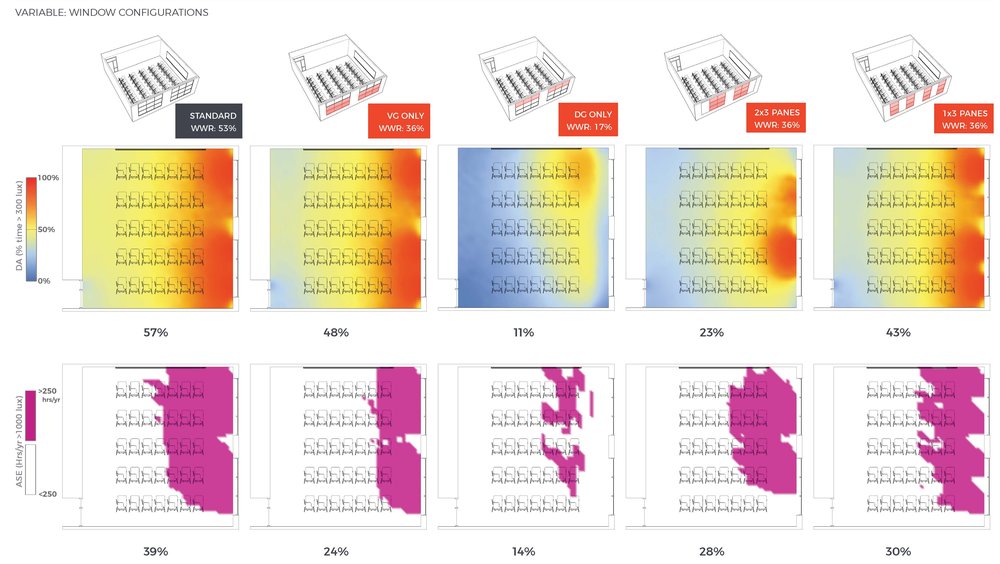
First, key days were decided based on site shading and local weather conditions. Then three glazing options were decided. the three options were a laminated glass with no Low-E coating, laminated glass with Low-E coating, and an insulated glazing unit (IGU) with Low-E coating.
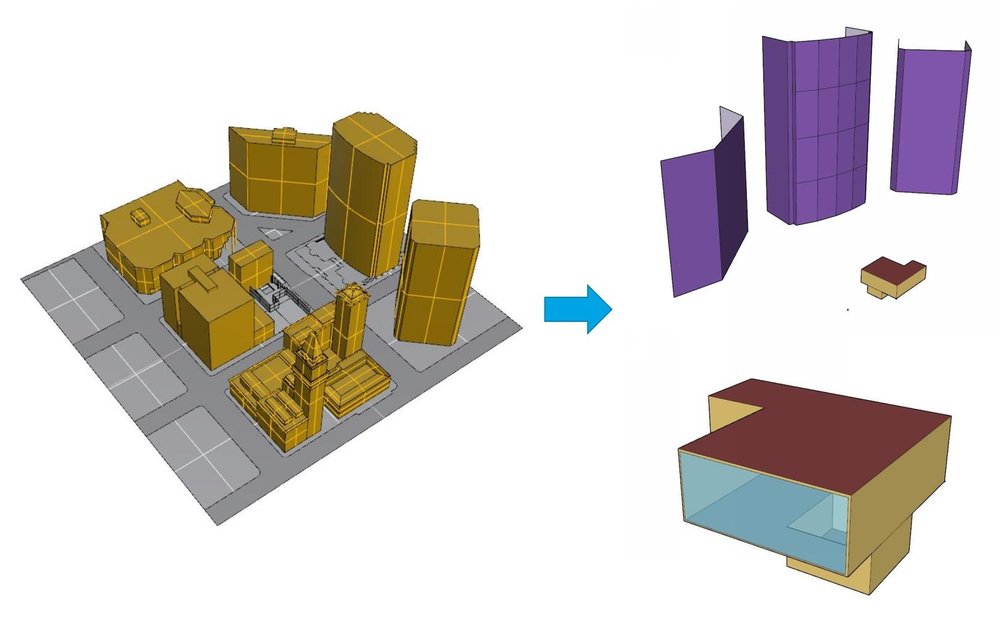
The geometry of the site and surrounding buildings provided from the architect was simplified and exported as a gbXML file using the Honeybee Plugin for Grasshopper. Then the model was taken into OpenStudio where an energy modeling analysis was done for the lobby only. This model took information such as the site shading, envelope construction, and design HVAC system into account to accurately simulate the air temperatures, surface temperatures, humidity, etc. for the entire year. This was done in OpenStudio instead of running the entire simulation in Honeybee so we have full control of the energy model and have confidence in the accuracy of the results. This path also saves time in the long run by not having to re-run the simulation.
The results of the model was then re-imported into Honeybee to create the micro-climate maps for key days identified in the shading analysis. A point analysis of areas of interest were doing to show how many hours of the year exceeds the comfort limit.
How did you visualize the results to the design team? What was successful about the graphics that you used to communicate the data?
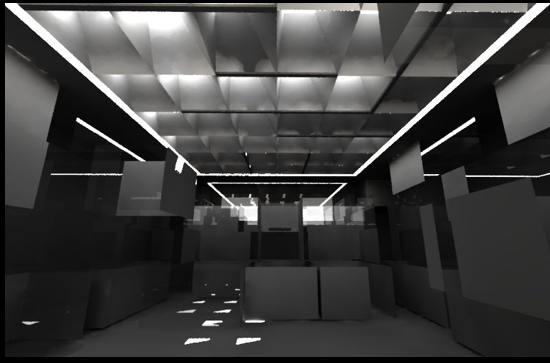
The results were visualized in Honeybee for Grasshopper using the energy modeling results from OpenStudio. A micro-climate analysis shows the standard effective temperature and predicted mean vote for key days when the sun hits the lobby glass from noon to 8pm for each of the glazing options. This graphic shows the movement of the direct sun onto the lobby floor where the hot discomfort will be felt.
The results where also visualized for key points in the lobby using a floodplot showing hourly results for the entire year in terms of PMV. Then discomfort hours were calculated for hot, warm, cool, and cold hours. The first point was on the receptionist desk where few occupants will be sitting there for the entire duration of the work day. The second and third points were on the benches located close to the glazing where people would not stay for long periods of time.
Most importantly, what did you learn from the investigation? How did simulation and its outputs influence the design of the project?
From this study, we learned that although the hot discomfort can be intense when sitting in direct sunlight, only a few hours a day will the discomfort be felt and in locations where occupants will not be sitting for long periods of time. The study also showed that cold discomfort was more of the issue when considering different glazing options for a well shaded lobby in the San Francisco Bay Area that the IGU reduced significantly in the mornings.
This study helped the architect and the client make an informed decision about which glazing options they should use.