PROJECT INFORMATION
Graphic Name: What is our target EUI?
Submitted by: Ramya Shivkumar
Firm Name: Newcomb & Boyd
Other contributors or acknowledgements (optional)
What tools did you use to create the graphic?
-
Excel
What kind of graphic is this? Bar Chart
Primary Inputs: Sample size of projects, CBECS site energy consumption, 2030 challenge target
Primary Outputs: Site Energy, Energy Star Score,
GRAPHIC INFORMATION
What are we looking at?
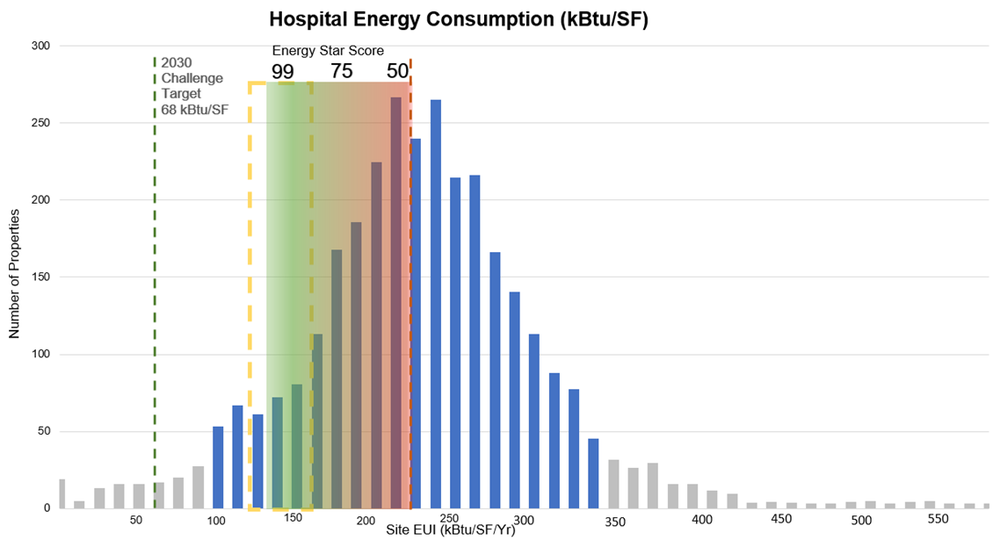
The graphic shows the sample size of hospitals and their site energy consumption. It then overlays energy star target score, including the anticipated score range for that project based on location/ zipcode. It uses the 2030 challenge target marker to help projects shoot towards that goal.
How did you make the graphic?
Used excel for graphical output, information from CBECS, target finder, 2030 Challenge.
What specific investigation questions led to the production of this graphic?
What is the EUI target for this building? If we target an EUI of xx kBTU/sqft, do you think we can get to an energy star score of 95 and upwards?
This question was asked during an early design analysis meeting. In a meeting with a owner/client (known for their portfolio of buildings), we were asked the question and it was difficult to pin down a number for them. But they was insistent and kept repeatedly asking for a number. Having this graphic at that meeting would have helped answer the question without picking a number. Steer the discussion towards strategies and goals rather than fixate on a number that would change based on design decisions down the road.
How does this graphic fit into the larger design investigations and what did you learn from producing the graphic?
Helped us understand the sample size. Correlate the target score with the site energy consumption. It also helped us appreciate the sample of projects that were closer to the 2030 challenge target goal. We also discovered an effective strategy to answer the question so what is our target EUI in meeting number #1.
What was successful and/or unique about the graphic in how it communicates information?
The graphic is a great conversation starter where instead of focusing on one number, we steer the conversation towards a range with goals and strategies. It also helps the client understand the correlation between energy star score and energy consumption, helping the design team to talk about 2030 challenge goals. It will also let the client appreciate how much they need to be onboard for the design team to achieve an aggressive target 100 kBTU/sqft (for a hospital in this case).
What would you have done differently with the graphic if you had more time/fee?
Modify it so we can use it for multiple projects. Get feedback from colleagues and clients to help make the graphic better.
Include EUI numbers key projects from the firm to get a better understanding of where we are in the spectrum. Will help understand the range for the kind of hospitals we have designed.