PROJECT INFORMATION
Graphic Name: What is the impact of building massing on annual energy use?
Submitted by: Carl Sterner
Firm Name: Sefaira
Other contributors or acknowledgements (optional) G 20-58901
What tools did you use to create the graphic?
-
Sefaira
-
Adobe Photoshop
-
SketchUp
What kind of graphic is this?
Primary Inputs: Building geometry, location, – and building-use-specific assumptions related to building envelope (utilizing prescriptive values from ASHRAE Std. 90.1) and mechanical systems (utilizing system templates in Sefaira).
Primary Outputs: Energy Use Intensity in kBTU/sf/yr
GRAPHIC INFORMATION
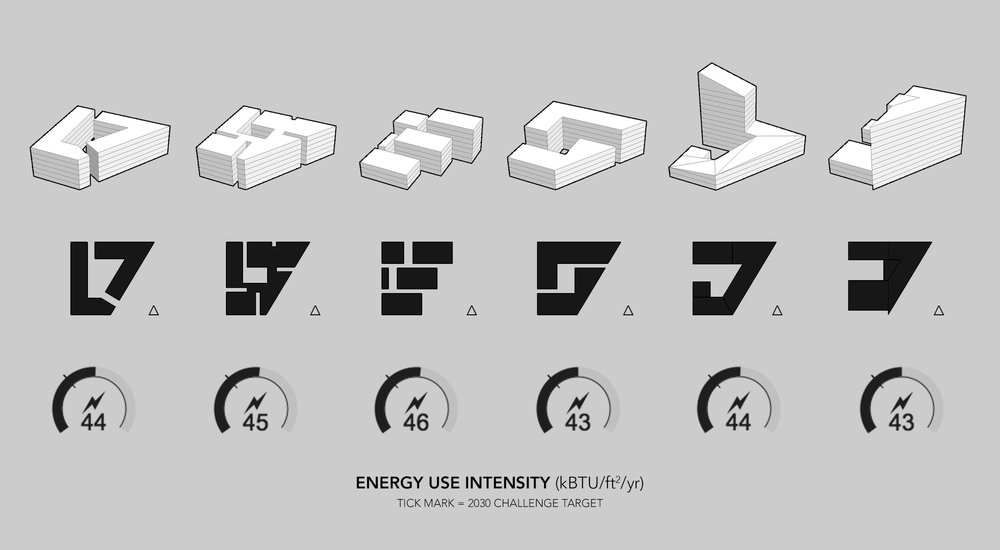
What are we looking at?
The graphic communicates how massing and site utilization strategies affect energy use, all else being equal. The top two rows show the design options (in perspective and plan views). The third row shows a dial representing EUI, with a tick-mark representing the project’s 2030 Challenge target.
How did you make the graphic?
I created massings in SketchUp and performed energy analysis using the Sefaira Real-Time Analysis plugin for SketchUp. I exported perspective and plan images from SketchUp (without glazing, in order to maintain focus on massing and not facade design), and screen captured the Sefaira results. I then combined these elements in Photoshop.
What specific investigation questions led to the production of this graphic?
– Which massing & siting option has lowest energy use?
– How much difference is there in energy use from adjusting massing alone?
How does this graphic fit into the larger design investigations and what did you learn from producing the graphic?
This is a very early-stage comparison that must be accompanied by other types of analysis for a complete picture (for example, analysis of peak heating and cooling loads, and/or a deeper dive into why the energy use varies between the options). The analysis re-affirmed basic sustainable design practices: reducing surface-area-to-volume ratio, and orienting facades primarily east-west, both reduce overall energy use — but only by about 7% at most.
What was successful and/or unique about the graphic in how it communicates information?
Its success is in its simplicity: isolating a single decision and a single metric. This simplicity makes the information accessible, but also invites questions — for instance, “why is the last option’s energy use so low with non-optimal orientation?” or “could the liabilities of Option 5 be addressed with good shading?” What follows from these types of question is robust discussion — perhaps more robust than would follow from a more complex graphic, which can lead to information overload or give the impression of an exhaustive analysis when much remains unexplored.
What would you have done differently with the graphic if you had more time/fee?
I would love to layer increasing levels of detail that could be shown as questions arise. For example, rows showing energy end uses, peak heating and cooling loads, sources of heat gains and losses could help “drill deeper.” The challenge would be balancing this against the clarity & simplicity of the graphic.