PROJECT INFORMATION
Submitted by: Morgan Maiolie
Firm Name: Waggoner and Ball
ASHRAE Climate Zone: 2A
Building/Space Type: Education, Museum
Who performed the simulation analysis? Architect – Design Staff
What tools were used for the simulation analysis?
Ecotect
What tools did you use to create the graphic?
Excel
Adobe Illustrator
Adobe InDesign
Adobe Photoshop
What phase of the project was analysis conducted? Conceptual Design, Schematic Design
What are the primary inputs of the analysis? Material surface reflectance, time of day, date, location
What are the primary outputs of the analysis? Daylight levels in footcandles
PROCESS
List the investigations questions that drove your analysis process.
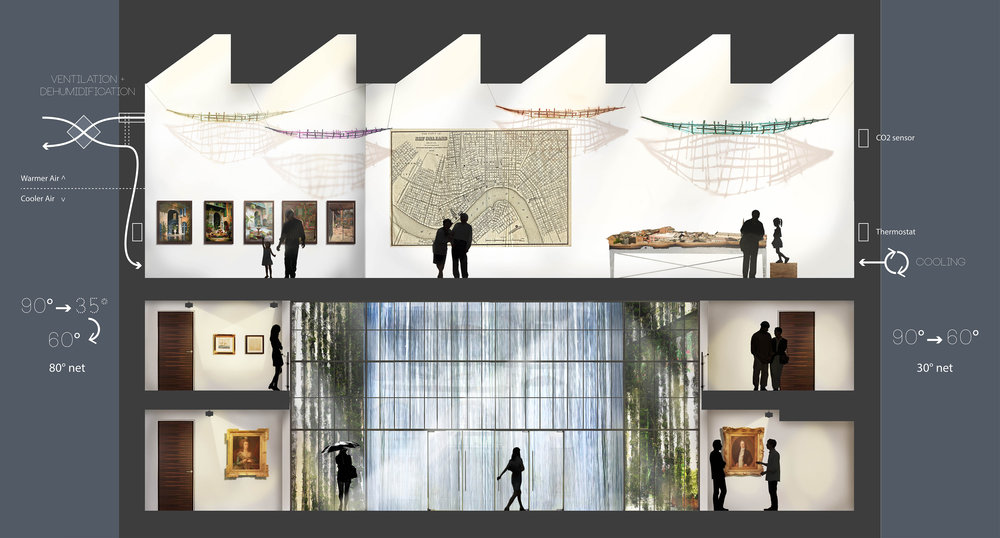
Can we daylight a museum with sensitive pen & ink exhibits? Can we daylight a first floor from a skylit third floor? How does our solar resource on site drive programming decisions? Can we use daylight to add dramatic and / or dynamic lighting to the museum experience? Can we integrate views to the west and maintain control of daylight levels? What is the experiential effect of providing surface brightness with daylight in the space?
How was simulation integrated into the overall design process?
We used an iterative process of daylight analysis to test myriad design questions.
One question was whether we could get useful daylight on three floors of the project. We were renovating a 3-story brick building where windows were feasible only on one side and we were curious about whether we could wash the windowless back wall with daylight from the skylit floors above. Daylight modelling showed this required a larger floor area loss than the project could support, so we focused our design on bright, daylit spaces on the top floors. The two lower floors were improved by an atrium after a separate series of daylighting analyses. Another early design question was whether we could hit an 18 fc / 4000 fc / yr target for sensitive pen and ink works. Analysis showed we could, but wouldn’t like the aesthetic and financial result, which changed our space programming for those works.
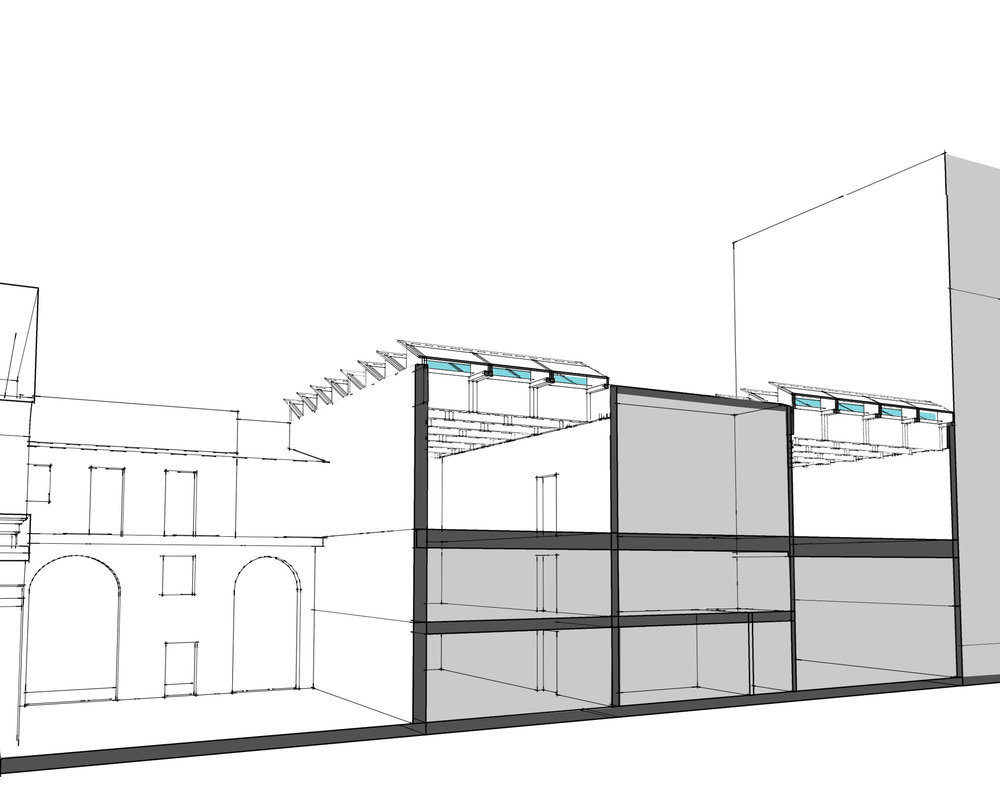
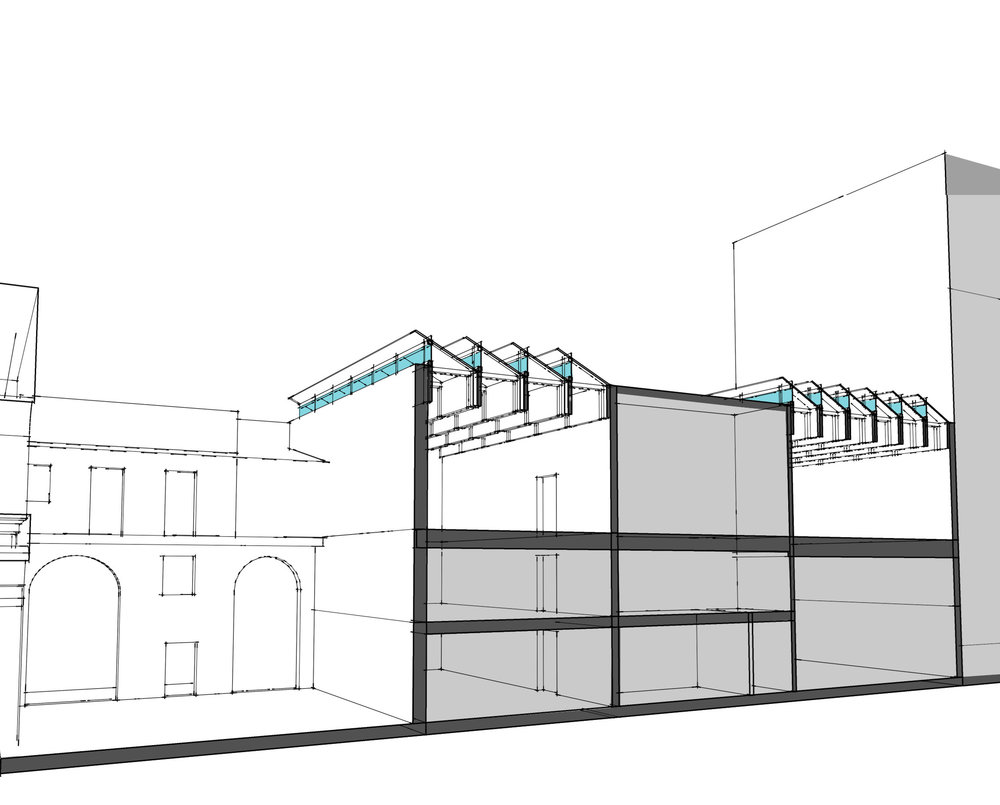
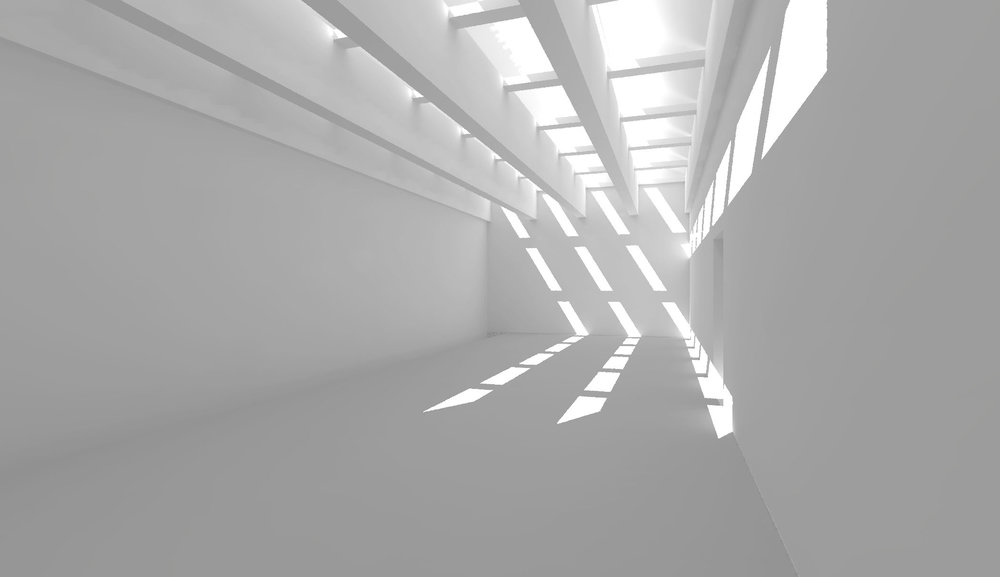
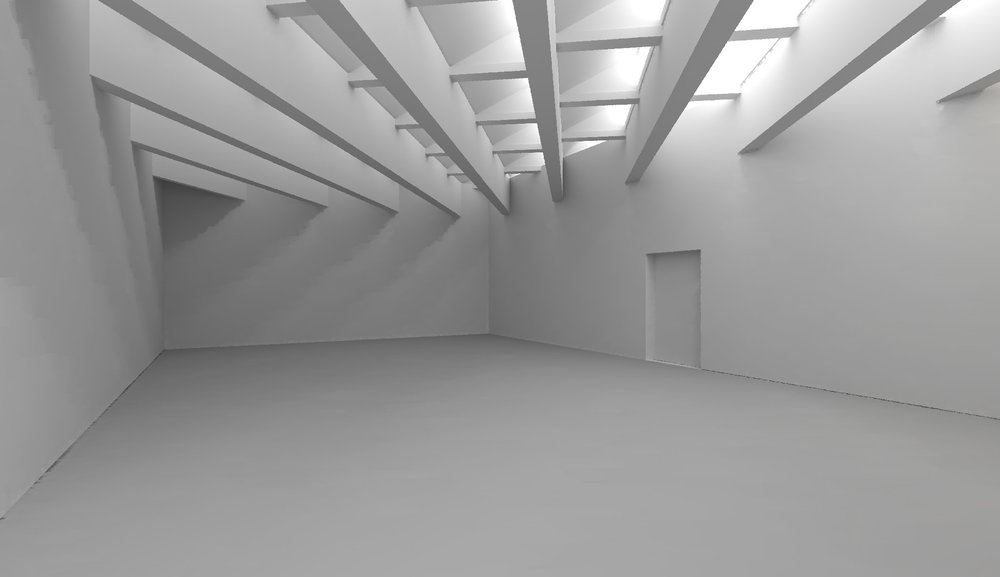
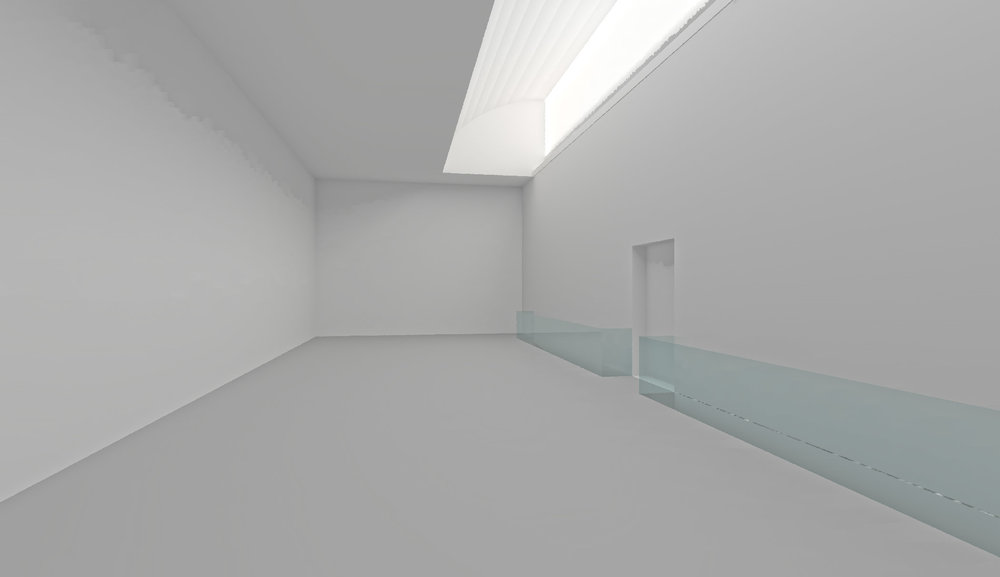
Moving through schematic design, we used daylight analysis to determine the shape and orientation of skylight monitors, as well as the window coverings and material surface brightness of top floor museum spaces. We decided on different daylighting strategies for the two top floor rooms based on their differing geometries / programs with a light scoop and sawtooth roof represented.
The daylight modeling process was integrated with the design process in that it was carried out by a designer on the team and presented with each formal design idea. We presented analysis to the client when we discussed design options.
How did you set up the simulation analysis and workflow?
We created a model from scratch in Ecotect and used Radiance to analyze it. We then exported graphic results and added information for presentation with Illustrator and Indesign.
How did you visualize the results to the design team? What was successful about the graphics that you used to communicate the data?
We found it wasn’;t intuitive to read the typical red-to-blue outputs from Ecotect and vizualized daylight intensity with a white-to-yellow-to gray palette instead. This helped our client and design team better understand the experiential difference between bright and dim areas. We also relied heavily on perspective outputs paired with daylight analysis grids to provide an experiential understanding of the different design decisions (while always mentioning that the way these show on screen isn’t a direct relationship with reality). Finally, we took daylight readings at museums the design team and client had visited and compared these with our results to give them a real-world baseline.
Most importantly, what did you learn from the investigation? How did simulation and its outputs influence the design of the project?
We really didn’t know how we could use daylight within the space – perhaps because of our relative newness to daylight design – so analyzing questions like whether an opening between a daylit space and the floor below could wash a wall sufficiently was really useful. Quatifying our daylight limits for museum exhibits was invaluable because the museum had only used electric lighting in their exhibits before. Attaching numbers to the different works (pen&ink versus oil paintings versus sculpture) helped us all understand programming for these works and their ability to connect with daylight.