PROJECT INFORMATION
Graphic Name: What is the impact of automated shading systems on energy efficiency, availability of natural light and view, visual comfort, and occupants’ productivity?
Submitted by: Amir Nezamdoost
Firm Name: Energy Studies in Buildings Laboratory – University of Oregon
Other contributors or acknowledgements (optional)
What tools did you use to create the graphic?
-
Adobe Photoshop
-
R
-
OpenStudio + EnergyPlus
-
Radiance + Custom Scripting
What kind of graphic is this?
Primary Inputs: (1) Blind schedule, including blind position and blind movement; (2) Time; (3) Sun penetration depth and vertical interior illuminance behind the window.
Primary Outputs: Hourly and annual percent of blind occlusion (per window group), hourly and annual number of blind movement (per window group), Hourly daylighting performance, Lighting schedule, hourly electric lighting analysis
GRAPHIC INFORMATION
What are we looking at?
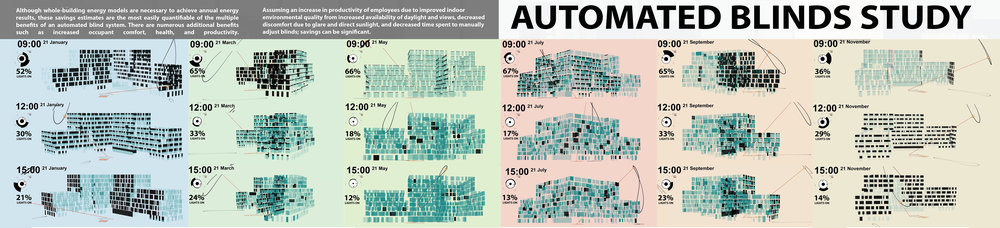
This set of images shows the individual blinds conditions of 691 window groups for 9:00am, 12:00pm, and 3:00pm during January, March, May, July, September, and November. The circular wind-rose summarizes the blinds occlusion for each facade while the 3D shows the three-dimensional plot of all windows and their condition for that point in time. The camera angle rotates around the window surfaces depending on the time of year to give a sense of depth while still exposing all window surfaces. The background color palette differentiates the time of the year being represented in each column set.
How did you make the graphic?
The individual point-in-time 3D plot were visualized using the R statistical analysis language by plotting the window geometry of the daylighting model. The results of the blinds operation simulation were also processed with R and applied to each respective window surface until the whole building's blinds positions are plotted. And finally, the specific sun direction is calculated, plotted, and tethered to a central north arrow for orientation. Separately, the wind rose blinds occlusion graphic is also produced in R by plotting four wedges and controlling their lateral fill based on the percent of window area that is being occluded by blinds on each of the four facades. These two pieces are then put together using either Adobe Photoshop or Adobe AfterEffects, depending on the desired output, along with the additional information like time, date, and percent occlusion values.
What specific investigation questions led to the production of this graphic?
1- How does the automated shading system work on different facades of the case study project?
2- What is the frequency of blind movement in the automated shading system?
3- What would be the position of automated blinds/shades in specific points-in time?
4- How much electric light consumption can be saved by using automated shading systems?
5- How much time can be saved by not operating blinds manually?
6- How much the balanced position of automated blinds can impact on aesthetics of building in comparison to haphazard position of manual blinds?
How does this graphic fit into the larger design investigations and what did you learn from producing the graphic?
This investigation allowed us to make relative performance comparisons among a variety of blinds operation algorithms to further understand the accuracy and reliability of specific simulation methods of complicated human behavior. This ultimately resulted in some of the more interesting visualizations showing the “haphazard” manual blinds algorithms contrasted against the uniform automated blinds algorithms. And on that note, we were also able to develop some interesting ways to process and visualize daylighting, energy, and blinds operation data that we can also utilize in future investigations. Lessons learned: – Different ways of making simulation data spatial and easier to understand and communicate. – Better understand blinds as they change over time, and the algorithms used to simulate their behavior as part of the design process.
What was successful and/or unique about the graphic in how it communicates information?
For blinds visualization we have annual results for 691 windows of the building, and needed a way to better understand and troubleshoot this data. R's plotting functions allowed us to visualize individual window surfaces and their blinds positions in 3D space. This method proved as effective and efficient throughout the simulation phase. Consequently, it also became an effective way to communicate the data and our findings to the clients by showing it in a similar manner as it is observed on actual building facades.
What would you have done differently with the graphic if you had more time/fee?
If we had more time, we definitely added more detailed geometry and landscape to this graphic. We also would include average percent of blind occlusion to each of the analyses.
Great contribution
awesome investigation!
Awesome investigation