PROJECT INFORMATION
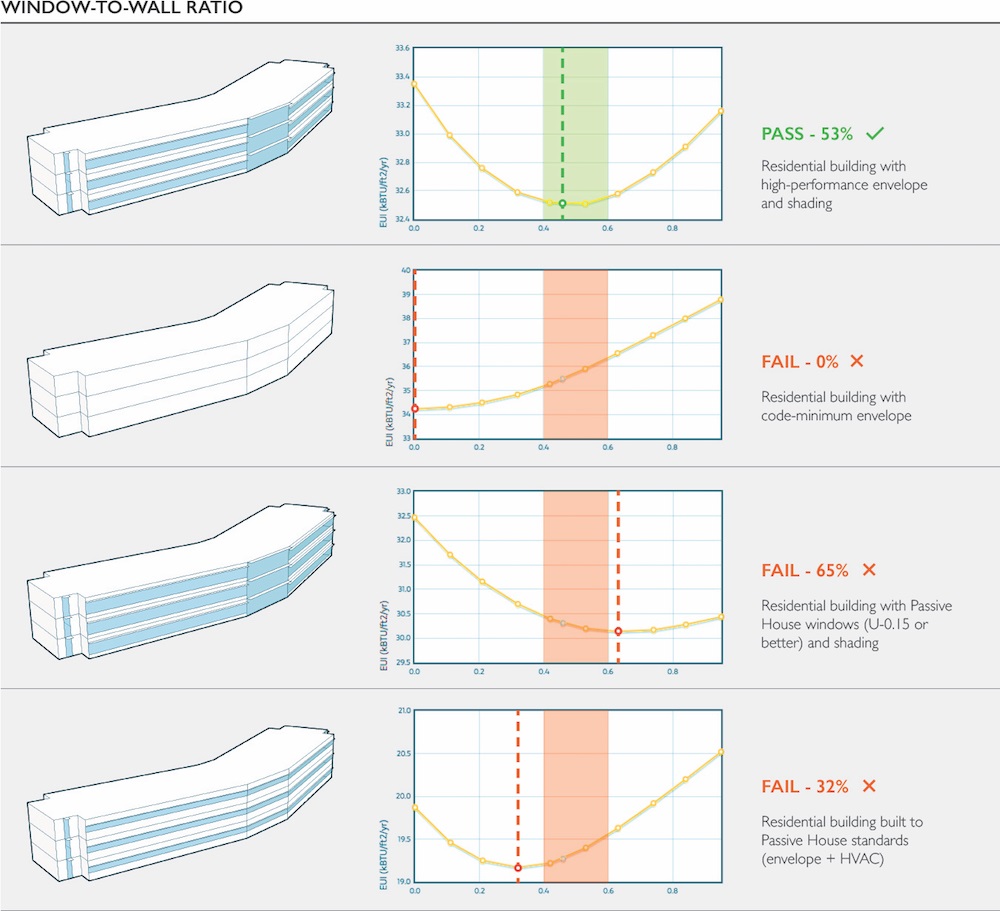
Graphic Name: What is the impact of window-to-wall ratio on Energy Use Intensity (kBTU/ft2/yr)?
Submitted by: Carl Sterner
Firm Name: Sefaira
Other contributors or acknowledgements (optional)
What tools did you use to create the graphic?
-
Sefaira
-
Adobe Illustrator
-
SketchUp
What kind of graphic is this? Scatter Plot
Primary Inputs: Building geometry, location, and location- and building-use-specific assumptions related to building envelope (utilizing prescriptive values from ASHRAE Std. 90.1) and mechanical systems (utilizing system templates in Sefaira).
Primary Outputs: Energy Use Intensity in kBTU/sf/yr
GRAPHIC INFORMATION
What are we looking at?
This graphic shows how the optimum southern window-to-wall ratio (WWR) for a building changes as other elements of the design change–illustrating that WWR cannot be optimized in isolation, or sized based upon generic rules of thumb. Each row illustrates an optimum south WWR given a specific envelope and mechanical system design, and shows whether the calculated optimum aligns with the range described by a prescriptive rule of thumb (illustrated as a shaded bar on the sensitivity graph). The optimum WWR changes dramatically based upon the properties of the envelope and mechanical systems, ranging from 0% to 65%.
How did you make the graphic?
-
Modeled building geometry in SketchUp
-
Uploaded the model to the Sefaira web application
-
Set up the various simulations (envelope, internal conditions, and HVAC parameters)
-
For each scenario, a ran a Response Curve to find the optimum South Window-to-Wall ratio looking at the impact on EUI. Exported the resulting graphic.
-
Used SketchUp to illustrate the optimum Window-to-Wall ratio for each scenario, and exported a high-resolution image of each.
-
Combined the model image and Response Curve image in Illustrator, adding linework and descriptive text.
What specific investigation questions led to the production of this graphic?
-
What is the optimum south window-to-wall ratio for this design?
-
How do changes to the building envelope and mechanical systems affect the optimum?
-
How accurate are rules of thumb regarding WWR?
How does this graphic fit into the larger design investigations and what did you learn from producing the graphic?
The major takeaway was that WWR cannot be optimized in isolation from the rest of the design. While we knew this in theory, the magnitude of the variation was still startling. It was particularly interesting to see the difference between the option that used “Passive House windows” (U-0.15) and the full “Passive House” option that included high insulation, high air-tightness, and high-efficiency mechanical systems with energy recovery ventilation. The full Passive House design reduced heating loads to such an extent that the design did not benefit from as much solar gain, resulting in a small optimum WWR. This exercise reinforced the need for continual stimulation throughout the process to ensure the design stays on track as the design evolves.
What was successful and/or unique about the graphic in how it communicates information?
The image graphically communicates analysis results, which makes the variation in window-to-wall ratio immediately apparent. It illustrates how changes to inputs create wide variation in outputs, and that rules of thumb cannot be relied upon for optimum results.
What would you have done differently with the graphic if you had more time/fee?
The inputs for each scenario are summarized on the right-hand side of the graphic. I would have liked to better clarify inputs vs. outputs, and perhaps find a way to represent the inputs graphically through iconography or sparkline graphics, so viewers can better understand what was changing between the various scenarios.
One Reply to “What is the impact of window-to-wall ratio on Energy Use Intensity (kBTU/ft2/yr)?”