PROJECT INFORMATION
Graphic Name: What is the impact of design and orientation on outdoor wind speeds and pedestrian comfort?
Submitted by: Eleanor Hoyt
Firm Name: Linnean Solutions
Other contributors or acknowledgements (optional)
What tools did you use to create the graphic?
-
Grasshopper Ladybug
-
Adobe Illustrator
-
Grasshopper Butterfly
-
Rhino
What kind of graphic is this? ??????????????????????????????
Primary Inputs: Local weather data, wind direction & speed, building geometry & orientation
Primary Outputs: Spatial wind speed in m/s
GRAPHIC INFORMATION
What are we looking at?
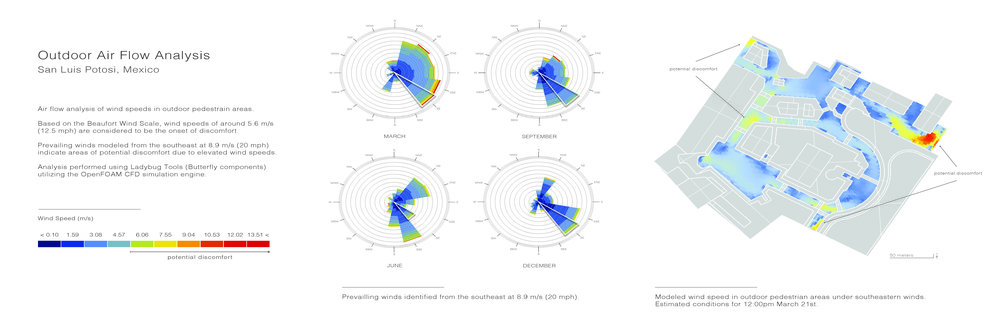
This graphic shows a simulation of outdoor air flow and wind speeds in pedestrian areas. Wind roses representing local wind conditions during four months of the year allow for identification of prevailing wind directions and speeds (m/s). Using a prevailing wind direction (southeast), site air flow is modeled in the project’s outdoor areas to assess pedestrian wind comfort. Wind speeds of potential discomfort are noted based on the Beaufort Wind Scale.
How did you make the graphic?
Local weather data and wind roses created using Grasshopper LadyBug are used to identify prevailing wind directions and speeds. Building geometry and surrounding terrain in Rhino were then simulation in a wind tunnel using the OpenFOAM CFD simulation engine through Grasshopper Butterfly. Simulation results are compared with the Beaufort Wind Scale to identify areas of potential pedestrian discomfort due to elevated wind speeds. Final results were processed using Adobe Illustrator.
What specific investigation questions led to the production of this graphic?
-
How will project design and building orientation impact outdoor pedestrian comfort?
-
Where and during what time of year might elevated wind speeds make the outdoor environment uncomfortable?
How does this graphic fit into the larger design investigations and what did you learn from producing the graphic?
This analysis was performed as part of an overall climate analysis, specifically investigating microclimates and outdoor pedestrian comfort. Given the design, orientation, and surrounding terrain, there was concern over high winds onsite making outdoor seating and walking areas uncomfortable or uninhabitable. This graphic, in combination with microclimate analysis of temperature and humidity, allowed the project team to identify areas where slight design modifications would enhance the outdoor occupant experience.
What was successful and/or unique about the graphic in how it communicates information?
This graphic illustrates how building design decisions may impact pedestrian comfort in outdoor areas. Visualizing wind speeds spatially using a color gradient allowed for easy identification of areas of potentially elevated and uncomfortable wind speeds. Identifying and adapting the design to account for such areas may enhance occupant engagement with outdoor spaces and contribute to the overall success of the project.
What would you have done differently with the graphic if you had more time/fee?