PROJECT INFORMATION
Graphic Name: What is the impact of orientation on average daily solar radiation?
Submitted by: Kjell Anderson
Firm Name: LMN Architects
What tools did you use to create the graphic? Ecotect
What kind of graphic is this? Polar Coordinate Plot
Primary Inputs: orientation degrees, solar climate data
Primary Outputs: average daily solar radiation in Btu/sf
GRAPHIC INFORMATION
What are we looking at?
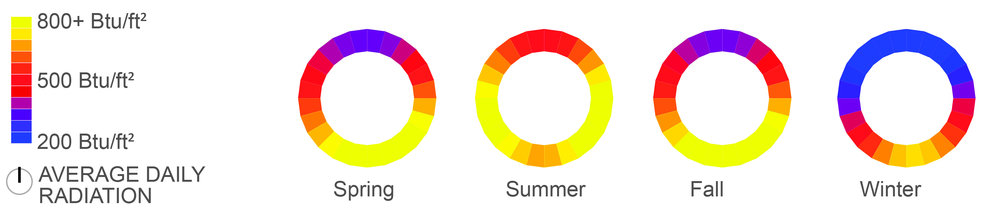
A Solar Rose is a cylinder that shows cumulative solar radiation over a time period, illustrating how much energy can be expected on a building with a given orientation. This one illustrates the solar energy for each 3-month period centered on the solstices and equinoxes using a TMY3 file for New York City.
How did you make the graphic?
A cylinder was located in Ecotect. Cumulative solar radiation was simulated for various time periods.
What specific investigation questions led to the production of this graphic?
Some climates have solar biases – more or less solar gain – towards the east of the west
How does this graphic fit into the larger design investigations and what did you learn from producing the graphic?
This was produced as part of a climate analysis that includes annual graphs of temperature, humidity, wind speed and direction, precipitation, solar energy and bias, and other metrics.
What was successful and/or unique about the graphic in how it communicates information?
This illustrates why east and west orientations are less desirable for large glazed facades in summer.
Hi Kjell, Nice graphic! The only improvement I’d suggest is the colours. If you want to convince a client that solar gain is bad on the east and west I’d say red is more likely to look "bad" than yellow. Maybe you could swap them around?