PROJECT INFORMATION
Graphic Name: What is the impact of building form on solar radiation’s contribution to peak cooling requirements?
Submitted by: Michael Sawford
Firm Name: ESDL USA, Inc.
Other Acknowledgements: EDSL Tas consultancy services
What tools did you use to create the graphic? EDSL Tas
What kind of graphic is this? 3-dimensional Heat map
Primary Inputs: building and site geometry
Primary Outputs: Solar radiation in kWh/m2
GRAPHIC INFORMATION
What are we looking at?
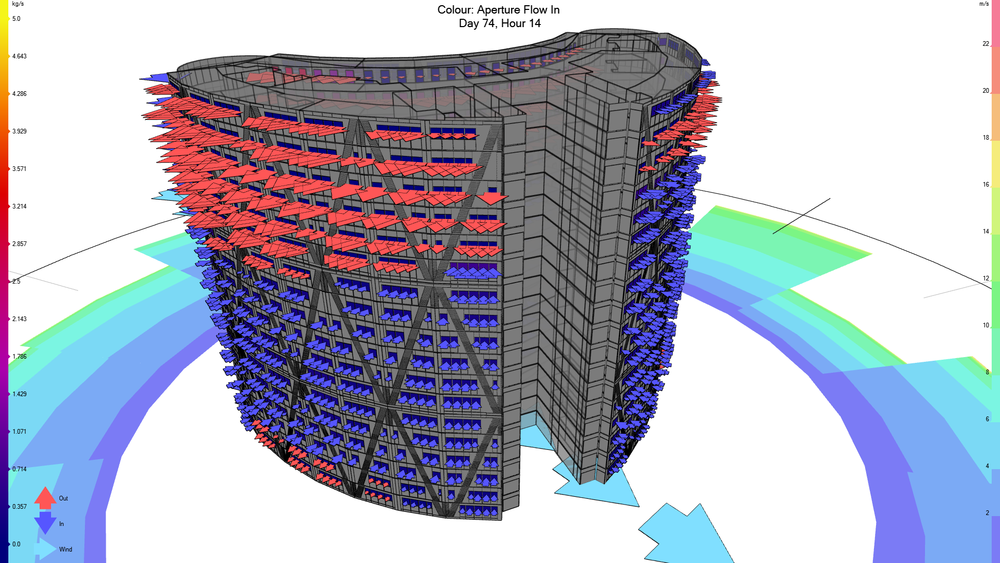
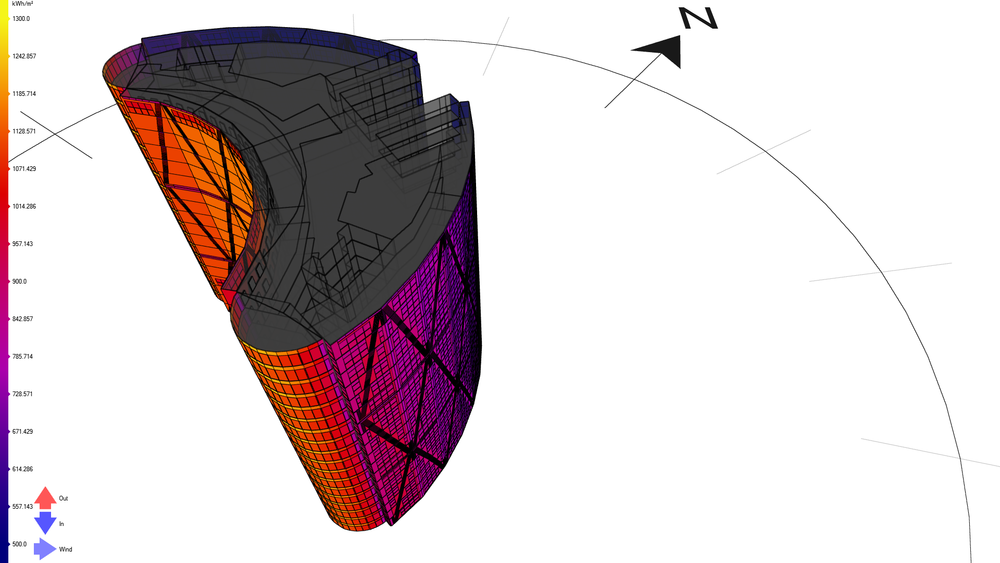
3D model of part of a building depicting the annual insolation (solar radiance over time) on the external building envelope using the solar data from the weather data for the building’s location. The compass rose is shown at the ground plane indicating the North direction. The kWh/m2 scale for annual insolation is found on the left-hand side of the image.
How did you make the graphic?
EDSL Tas was used to create the 3D model. The results of the annual insolation can be displayed by choosing the weather data for the building’s location. The annual insolation is shown visually in the tool for live interaction. The 3D model view can be interrogated in real time in an interactive fashion. However, using automated reporting tools in EDSL Tas software you are able to export images (as uploaded), a series of images, or videos.
What specific investigation questions led to the production of this graphic?
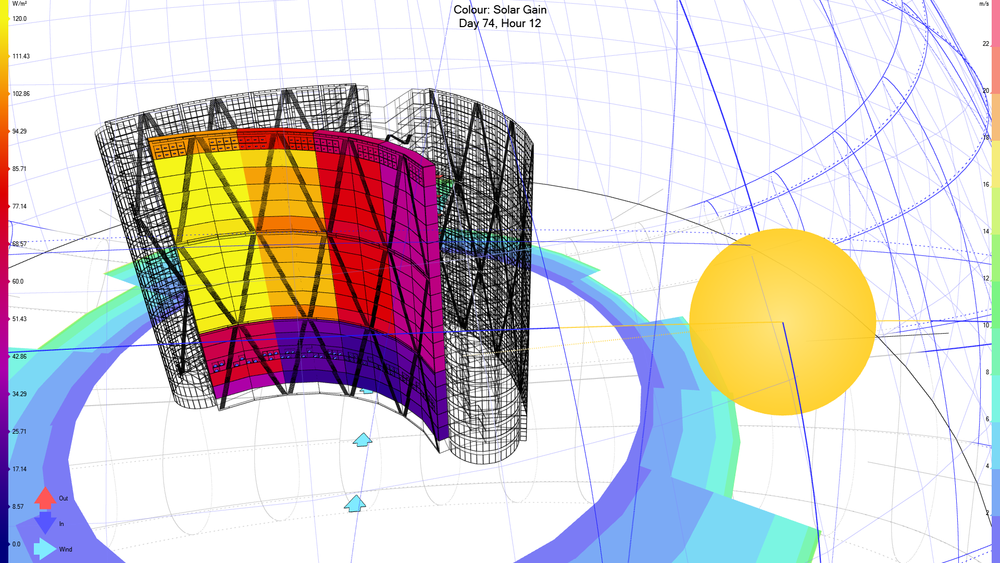
How could the building form impact peak cooling requirements? Investigation of the building form and its interactions with solar data for the building’s location. What would be the impact of the south facing circular spaces found at each end of the curved façade.
How does this graphic fit into the larger design investigations and what did you learn from producing the graphic?
This is one view of the visual data used to communicate the impact of the building form on annual insolation (solar radiance over time) on a surface by surface basis, which can highlight areas of interest regarding peak cooling due to high exposure to solar gain to the design team/owner. Videos orbiting the annual data shown on the 3D model were created as well as showing the data from within the EDSL Tas software.
What was successful and/or unique about the graphic in how it communicates information?
Being able to show the annual insolation data, whether in still images or in videos orbiting the building, allowed for easier communication of the data in context with the building. Flexibility in choosing which information to display in the graphic and how the output is created was a great benefit in visualizing the data. (For example, options to create a single image for a particular view of the model, or a series of images created stepping through an orbit of the 3D model could be automatically created. Or creating a video to capture the orbit around the model.) When viewing the 3D model view within the EDSL Tas software (prior to export), if you mouse over a particular surface in the building envelope, information about the surfaces annual insolation is displayed, this allows you to interrogate the data in real time in an interactive fashion.
What would you have done differently with the graphic if you had more time/fee?
Adjusting the geometry, by importing a new Revit model or directly altering the EDSL Tas model, and analysing the impact on the annual insolation could have been an interesting study to compare building form options.