PROJECT INFORMATION
Graphic Name: What is the impact of operable window openings on the distribution of peak air velocities at different levels of a facade?
Submitted by: Michael Sawford
Firm Name: EDSL USA, Inc.
Other contributors or acknowledgements (optional) EDSL Tas consultancy services
What tools did you use to create the graphic? EDSL Tas
What kind of graphic is this? Natural Ventilation Vectors / Spatially Integrated
Primary Inputs: building geometry, window operability information
Primary Outputs: Peak air velocities by hour (m/s), mass flow rate (kg/s)
GRAPHIC INFORMATION
What are we looking at?
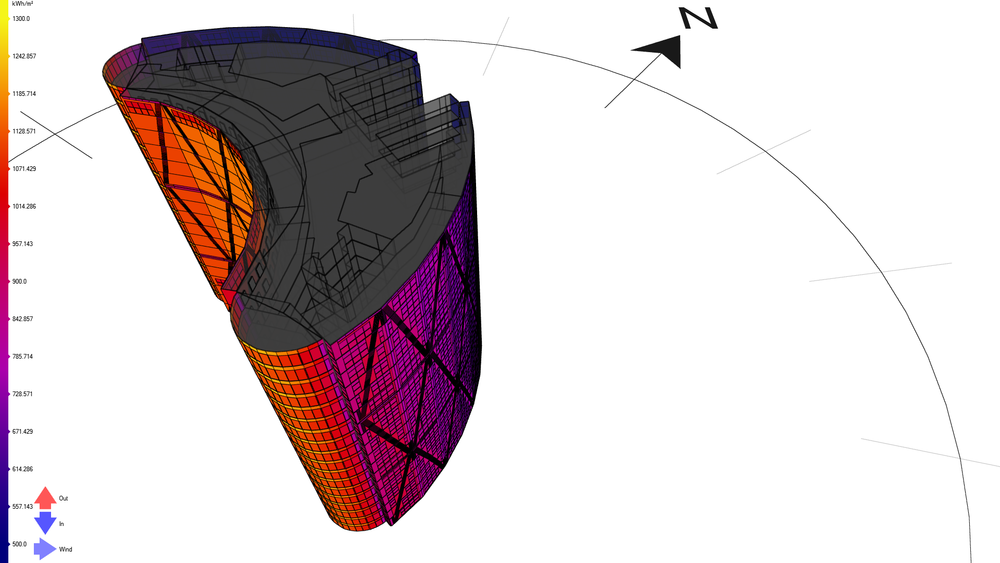
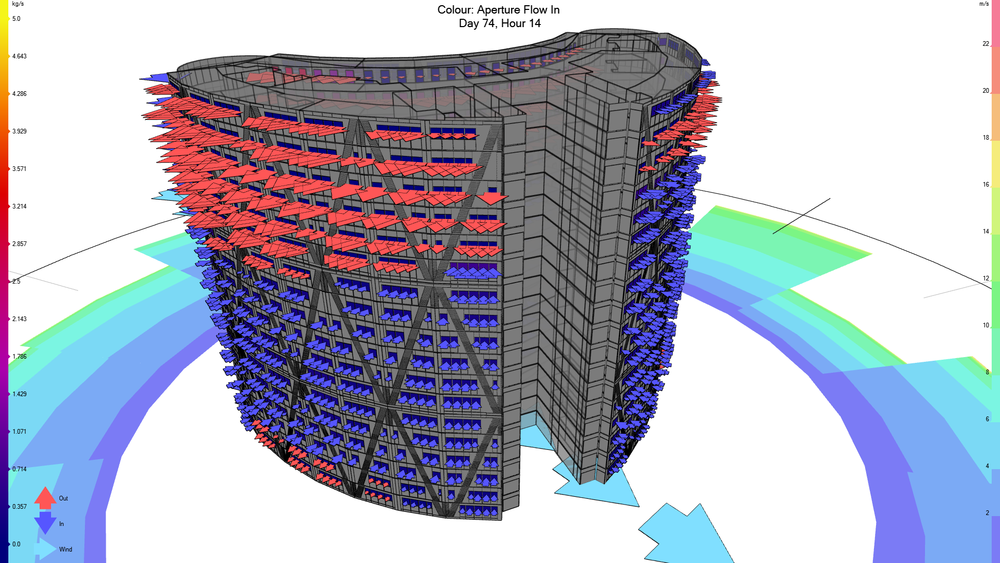
3D model of part of a building depicting the natural ventilation air flows in and out of modelled spaces taking into account; the wind speed/direction of the location at a given hour (day 74 hour 14, as shown at the top of the image), the altitude, and the stack effect. Light blue arrows at the base of the building section indicate the wind direction for the hour being displayed. Magnitude of each arrow (ligh blue, red, navy blue) represents the speed of the air. Direction of the red/navy blue arrows show the direction of flow. The wind rose is depicted on the ground plane, the metres per second scale for wind speed is found on the right hand side of the image. The mass flow rate in kg/s for the wind speed is found on the left hand side of the image. A key is located in the lower left hand side for the flow arrows.
How did you make the graphic?
EDSL Tas was used to create the 3D model, input natural ventilation openings and their control functions, and simulate the building. The results were then showed visually in the tool for live interaction. Using automated reporting tools in EDSL Tas software the image was produced.
What specific investigation questions led to the production of this graphic?
Validation of a natural ventilation scheme. Understanding the impact of the location of openings and the building form together with the wind data for the location. Understanding the impact of the Chinook winds on the natural ventilation strategy. Understanding the impact of the full building section height atrium space on the concave side of the building and its interaction with open plan office spaces in the greater floor plate of the building.
How does this graphic fit into the larger design investigations and what did you learn from producing the graphic?
This is one snap shot of the visual data used to communicate the natural ventilation strategy to the design team/owner. Videos showing the natural ventilation scheme varying by hour were also produced to communicate the results. Natural ventilation could maintain comfort levels in the office spaces.
What was successful and/or unique about the graphic in how it communicates information?
Being able to show the natural ventilation scheme in action, whether in still images or in videos, allowed for easier communication of the data in context with the building and subdivided spaces. Flexibility in choosing which information to display and how the output is created was a great benefit in visualising the data. (For example, options to create a single image for one hour, or creating a series of images in order to step through each hour of a particular day for a slide deck could be automatically created. It is also possible to create a video to capture the responses of the building to changing wind conditions hour by hour.) The visual data can also be accompanied with tabulated hourly data of aperture air flow rates where peak flow rates can be assessed in a more granular fashion. When viewing the 3D model view uploaded within the EDSL Tas software (prior to export), if you mouse over a particular surface/arrow in the model, information about the surface/space/air flow rate is displayed, this allows you to interrogate the data in real time in an interactive fashion.
What would you have done differently with the graphic if you had more time/fee?
I could have opted to remove the compass (showing the North arrow) from the view as it is not visible in the current view. By orbiting around, zooming out further I could have navigated the 3D model view whereby the North arrow information could have been useful to the graphic output. Accompanying the data with an indication of peak air velocities would have provided context to the feasibility of naturally ventilating the building.