PROJECT INFORMATION
Submitted by: Xiaofei Shen
Firm Name: AECOM
Other contributors or acknowledgements: Aman Singhvi, Jason Vollen
ASHRAE Climate Zone: 4A
Building/Space Type: Office
Who performed the simulation analysis? Architect – Internal Sustainability Personnel
What tools were used for the simulation analysis?
-
Grasshopper Ladybug
-
Grasshopper Honeybee
-
Rhino-DIVA
What tools did you use to create the graphic?
-
Adobe Illustrator
What phase of the project was analysis conducted? Schematic Design
What are the primary inputs of the analysis? Window Geometry, Shading Geometry
What are the primary outputs of the analysis? Daylight Distribution, Solar Radiation, Heating and Cooling Load
PROCESS
List the investigations questions that drove your analysis process.
What is optimum Window/ Wall Ratio for Daylighting? What is the reduction in annual daylight based on external shading systems? How fenestration and shading design holistically affect the building performance? How to obtain the most optimal facade trade-offs for balanced daylight and energy?
How was simulation integrated into the overall design process?
The study was conducted when the design team reached out for quantifiable design guidelines to inform the facade conceptualization process during the schematic design phase. The aim was to achieve best performance of the space with respect to daylight and energy.
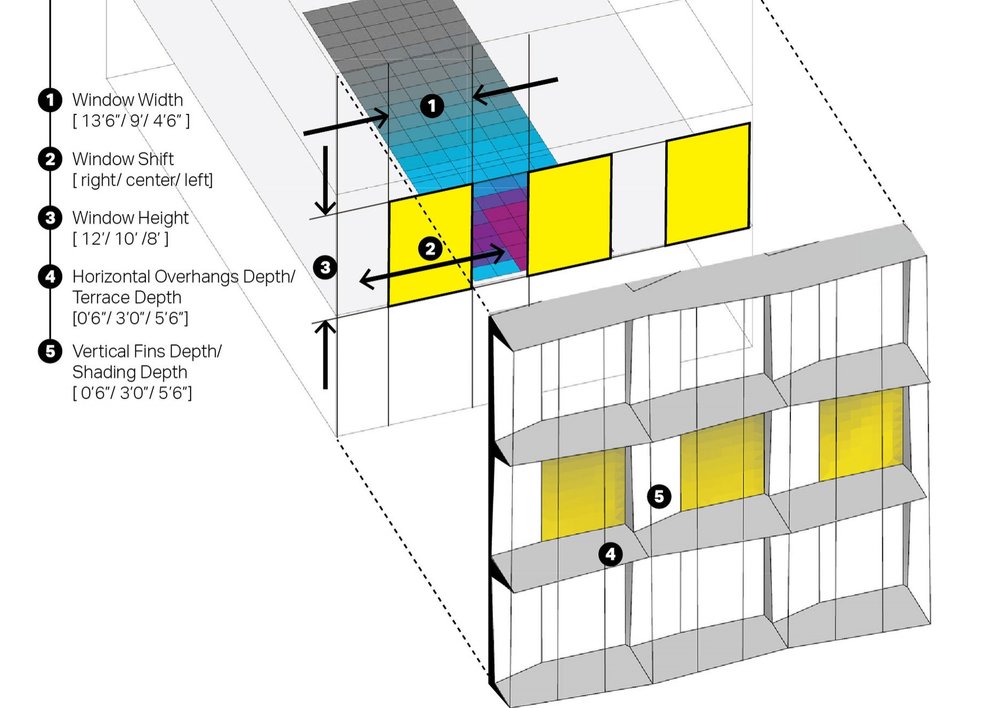
The number of design iterations are massive due to multiple variables involved. More than 200 solutions were generated with various window widths, height and location as well as shading types (horizontal or vertical) and shading depth. Moreover, the performance related objectives, including minimizing glare area, minimizing under-daylit area, minimizing solar irradiation on the glazing, and minimizing heating/ cooling loads are all conflicting to each other due to their mutually exclusive dependencies.
An automatic Multi-Objective Optimization was utilized for rapid exploration of options and optimization at early stage of design for quick decision making.
How did you set up the simulation analysis and workflow?
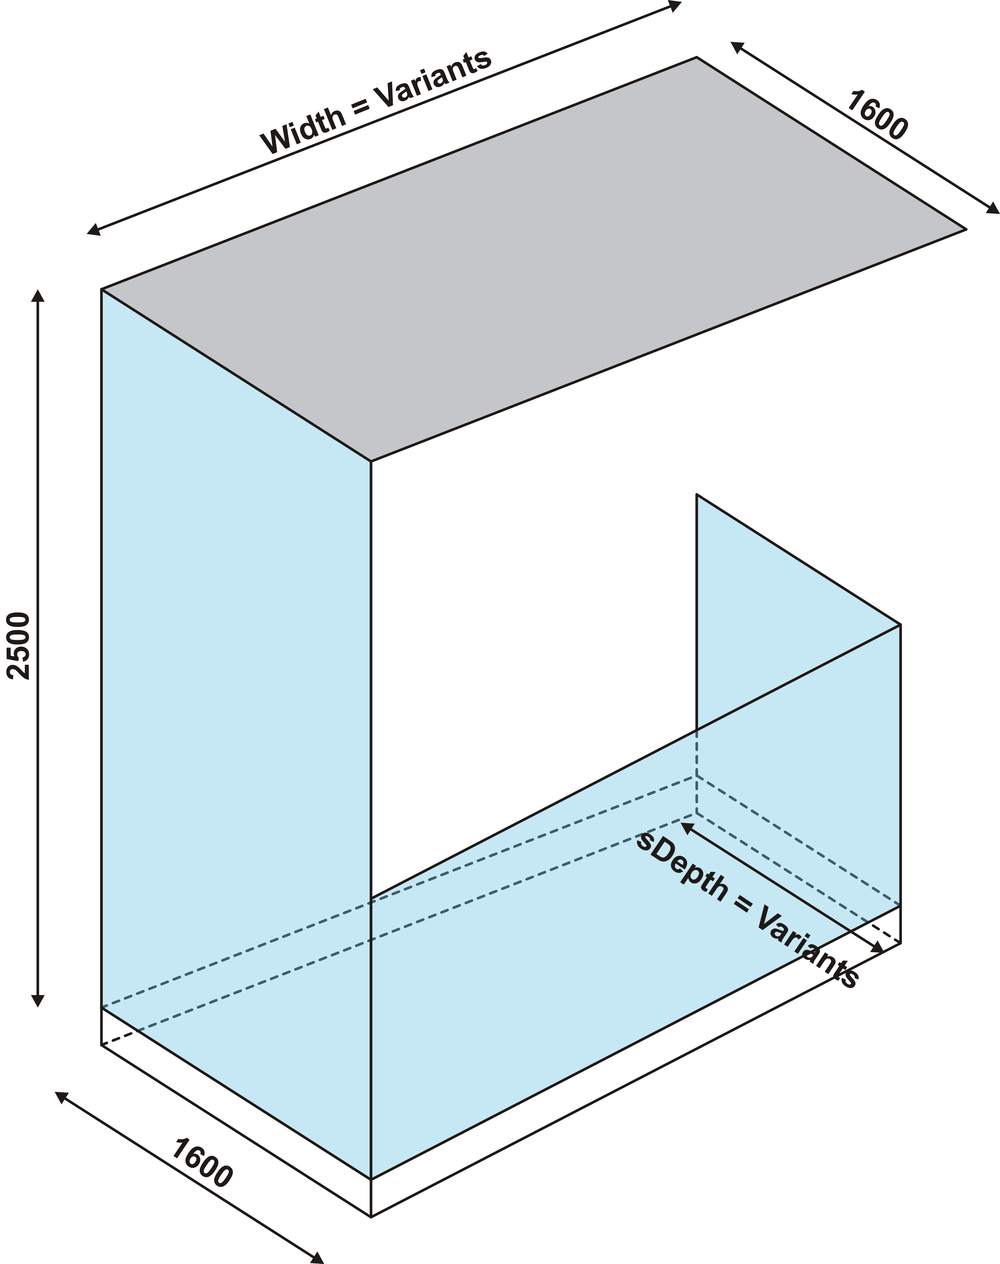
A typical south-faced bay space in an office building located in DC with a total floor area of 2,500 sf was modeled using Rhinoceros 3D modeling software and Grasshopper plugin. The pre-determined variables, such as windows and shadings, were parametrically constructed. Parameters controlling window dimensions, type of shading and shading depth were setup to vary within predetermined limits set based on design constraints.
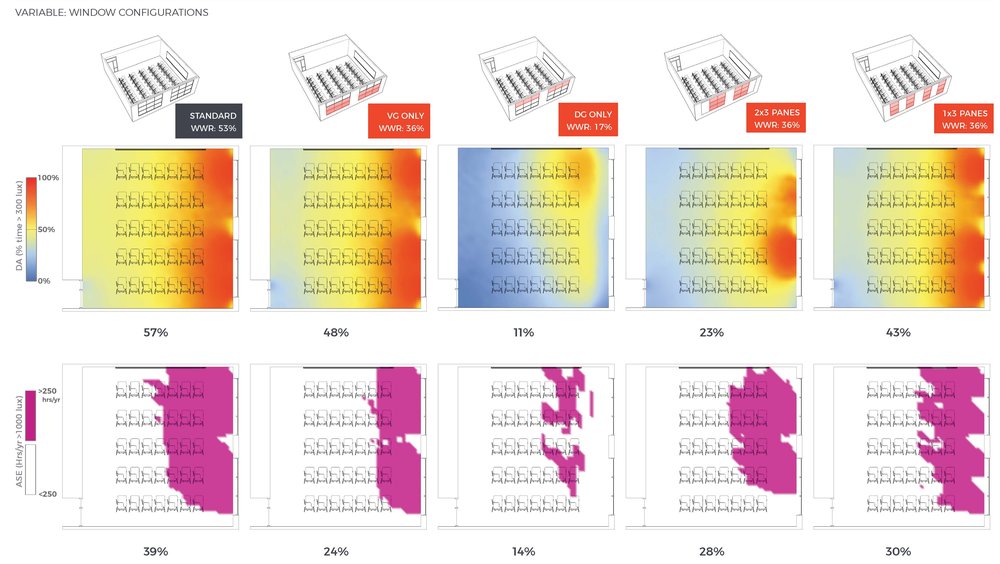
The initial iteration was connected to DIVA daylight simulation software. Sensors were placed at a 12-inch square grid. Two daylight simulations were carried out to get Illuminance levels at 9 am and at 3 pm at the design day (Sep 21st). Colored Illuminance maps and numeric values of lux levels on each floor were outputted. The iteration was also connected to DIVA thermal analysis software. Room boundaries were set up as typical climate zone 4A materials. Heating and cooling loads related to the facade elements were simulated and recorded.
Colibri for Grasshopper was selected to automatically trigger the simulations and save both inputs and outputs for this experiment. The recorded values were connected to a customized script in Grasshopper for further result sorting and finding.
How did you visualize the results to the design team? What was successful about the graphics that you used to communicate the data?
The building performance simulation is traditionally time-consuming and the report is usually hard to understand with redundant information showed. To visualize such a complex process of multi-objective optimization, variable clusters as well as energy data was an equally challenging task as well to represent in one or more graphics. The resulting visual simplified the raw data in Adobe Illustrator with minimized information presented but in a more graphic way, such as variables with 3D geometries and objectives with 3D bar charts. This visualization made it considerably easier for clients and designers to understand the results as compared to just stats and numbers.
Additionally, multiple recommendations were provided with their performance values listed through a filtering and sorting process. Preferred options were selected based on constraints and bios after discussion with the designers. A more detailed 3D section was also provided for a closer look of the potential development of the selected solution.
Most importantly, what did you learn from the investigation? How did simulation and its outputs influence the design of the project?
This evolutionary trade-off analysis tool is the best way to provide performance feedback for design decision support in a quicker and comparatively more accurate way, especially at the beginning of the conceptual stage when there are multiple iterations generated from the parametric models. By managing the Window/Wall Ratio, shading dimensions and wall construction types, the rich-data multi-task methodology were utilized for better performance on daylighting, thermal comfort, energy load and cost, making the optimized facade result more reliable.
The user-friendly graphics made the design decision making more efficient. Multiple stakeholders could get involved into the discussion when the complex data was well visualized.
Findings from this analysis: the optimized modular design of the facade with Window/ Wall Ratio 50% and 6’ horizontal shadings properly mediates summer solar exposure but still ensures daylight penetrating reducing both lighting load and heating/cooling load. Glare control and reduced contrast ratio improves the visual comfort. The facade is further integrated with building systems. For example, outdoor air is pre-cooled and pre-warmed through the localized DOAS units and Heat Exchangers embedded in the modules.