PROJECT INFORMATION
Submitted by: Hoang
Firm Name: Transsolar
ASHRAE Climate Zone: 5B
Building/Space Type: Residential
Who performed the simulation analysis? External Energy Consultant
What tools were used for the simulation analysis?
-
Grasshopper Ladybug
-
Grasshopper Honeybee
-
TRNSYS
-
Python
What tools did you use to create the graphic?
-
Grasshopper Ladybug
-
Grasshopper Honeybee
-
D3.js
What phase of the project was analysis conducted? Schematic Design
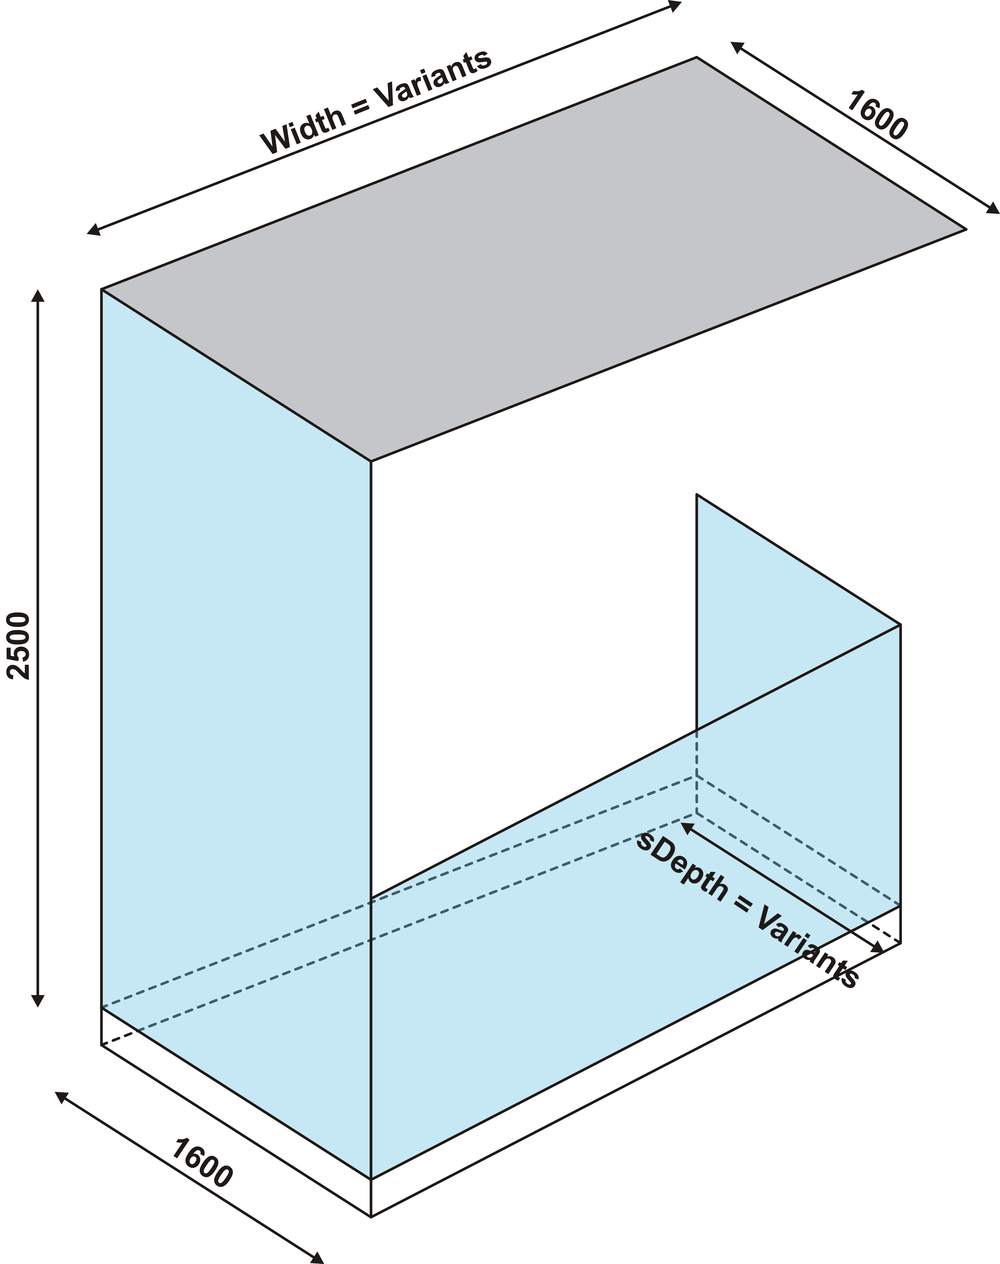
What are the primary inputs of the analysis? Balcony Geometry
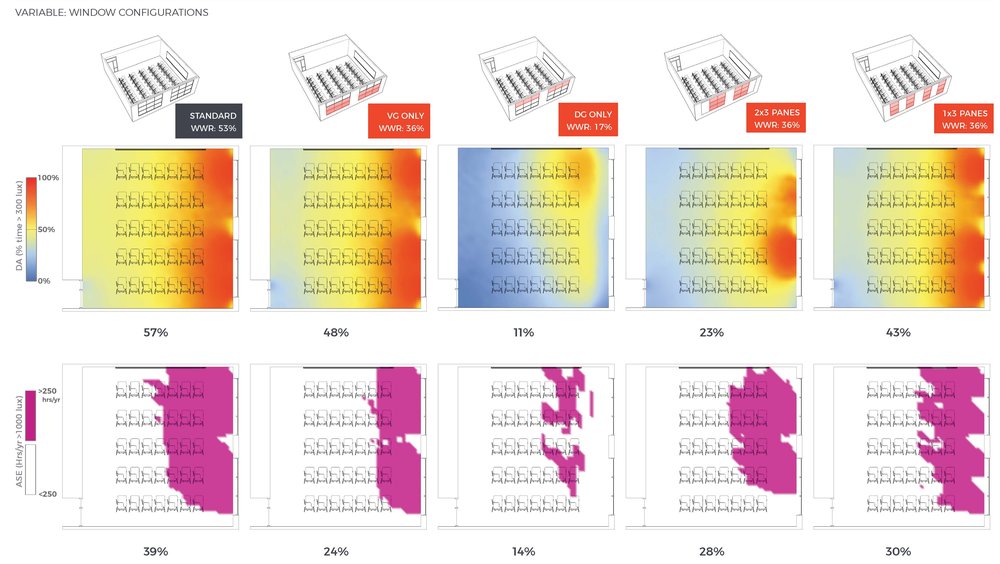
What are the primary outputs of the analysis? Total solar energy generated per balcony, indoor visual comfort quality
PROCESS
List the investigations questions that drove your analysis process.
What would be the most optimum shape for a balcony in order to gain as much PV power as possible while ensuring the indoor visual comfort?
How was simulation integrated into the overall design process?
The simulation is carried on side-by-side with the evolution of architecture design, allowing crosschecking and providing feedback to each iteration of architecture design. An interactive html graphic was created allowing the team to “view and play” with it at the same time, understanding how each parameter can have an impact to the final design goal.
How did you set up the simulation analysis and workflow?
A dynamic Grasshopper model of the architecture design was set up in order to perform fast and reliable simulations as the floor-plan evolve through each iteration. The simulation model evaluates different balcony geometries through different criteria, including: PV power generated on the facade, solar exposure on the window, indoor visual comfort. After having the simulation results, a Python script was used to generate an interactive parallel-coordinate graph, visualizes all variants together as a part of a multi-objective study. This allows the architect to select the optimum geometry as well as understand how each parameter can impact the final goals of the design.
How did you visualize the results to the design team? What was successful about the graphics that you used to communicate the data?
The final graphic is html file (parallel coordinate, generate by Python plotly package) which can be easily opened by anyone via internet browser. In addition, the graphic is interactive, therefore the design team can “play” with the graphic to not only pick out the most optimum solution for a multi-objective study but also to understand the impact of each parameter to the design goals.

Most importantly, what did you learn from the investigation? How did simulation and its outputs influence the design of the project?
The investigation is a great opportunity to know the complexity of the building and understand the depth of involvement required to make accurate building model. Also this process allows us to apply our current knowledge to test the feasibility of design strategies.