PROJECT INFORMATION
Submitted by: Melissa Kelly and Elliot Glassman
Firm Name: WSP Built Ecology
Other contributors or acknowledgements: Cortney West developed the scope and structure of the study in an earlier iteration
ASHRAE Climate Zone: 4A
Building/Space Type: Education
Who performed the simulation analysis? External Energy Consultant
What tools were used for the simulation analysis?
Rhino – DIVA
What tools did you use to create the graphic?
Excel
Adobe Indesign
What phase of the project was analysis conducted? Post Occupancy
What are the primary inputs of the analysis? Orientation, window configuration, shading configuration, and interior finishes
What are the primary outputs of the analysis? Spatial daylight autonomy (sDA), annual sunlight exposure (ASE)
PROCESS
List the investigations questions that drove your analysis process.
What are the key design decisions that may help or limit achievement of the LEED v4 Daylight credit? To what extent is daylight quality determined by orientation? Are there any specific considerations for rooms based on orientation?
How was simulation integrated into the overall design process?
The simulation process began with the single goal of coming as close as possible to meeting the LEED v4 Daylight credit criteria for as many configurations of a prototype classroom as possible. Parametric variables were determined through discussion with the design team in order to map out which aspects of the design were fixed and which were flexible. We then ran cases illustrating each potential design change, and presented initial results for discussion at a team meeting. With their feedback, we then looked at a few other opportunities of interest and re-rand the simulations. While the simulations themselves could not be interactive, the setup and results allowed us to have meaningful and detailed discussions.
How did you set up the simulation analysis and workflow?
The initial setup involved building out a shoebox model from floorplans and creating an Excel spreadsheet of each design change under consideration. This spreadsheet then became an input source for a Grasshopper for Rhino script which automated the creation and running of DIVA simulations. The script automatically exported ASE and sDA results into a spreadsheet and saved image files for each case. We then post-processed the results in Excel, and created an InDesign file with linked images which could automatically update. This saved a lot of time and effort at the beginning and end of the process.
How did you visualize the results to the design team? What was successful about the graphics that you used to communicate the data?
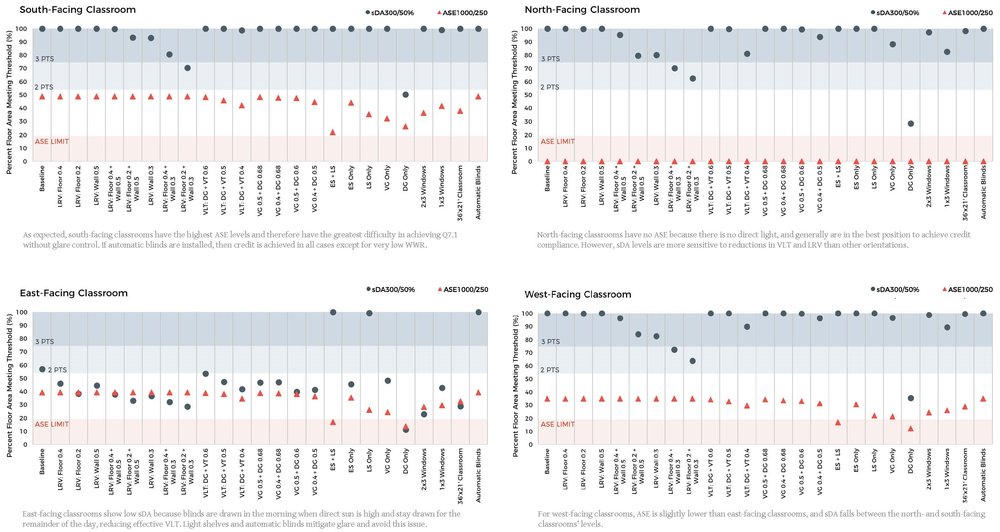
To answer the question of which design decisions create the greatest risk (or best opportunity) for achieving the LEED v4 credit, we plotted the range of results for each parameter by orientation. This helped to illustrate that there are a few variables which are critical to achieving high quality daylighting, while other areas could be more flexible without risking daylight access.
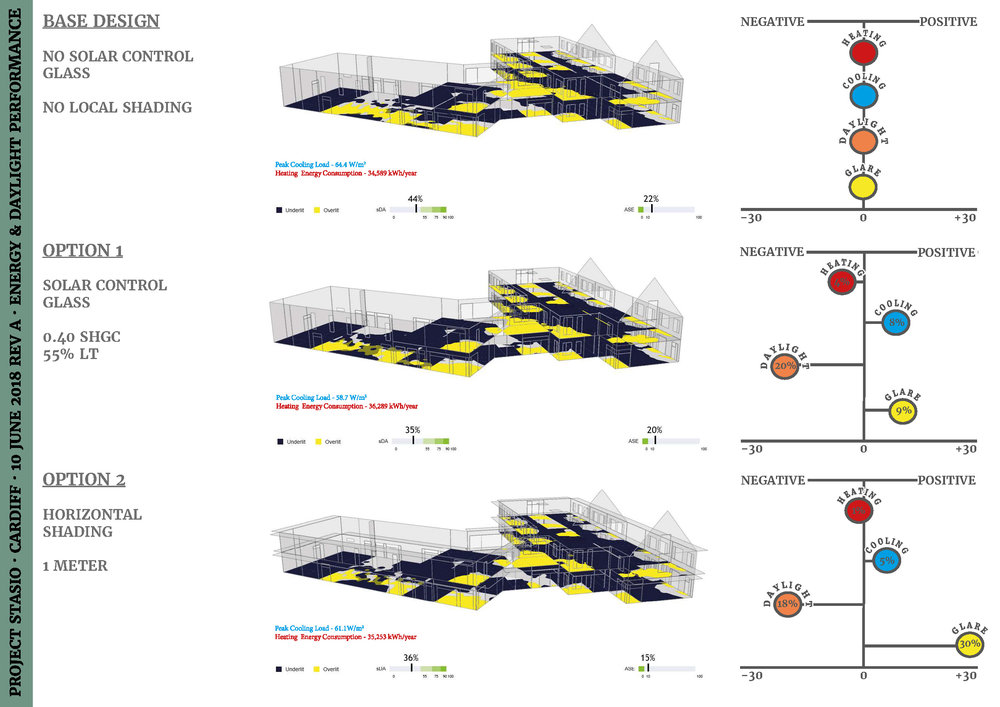
One challenge of presenting daylighting results, particularly for the LEED v4 criteria, is that it requires the balance of two opposing metrics rather than the optimization of a single metric. To look at the results on a granular level, we initially plotted ASE and sDA individually by orientation, but it didn’t tell the whole picture on daylight quality. To solve this, we created compact graphs with both sDA and ASE results for each case, with a shaded background showing the LEED credit thresholds. Having one metric where lower is better and another where higher is better could be confusing, but the shaded background and color-coding helps to frame the data.
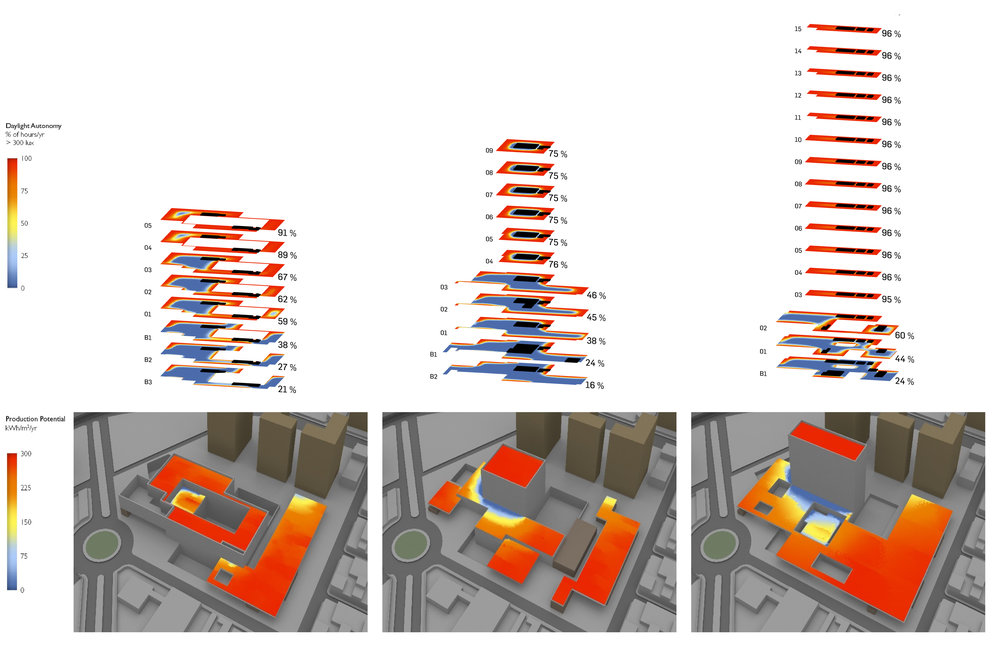
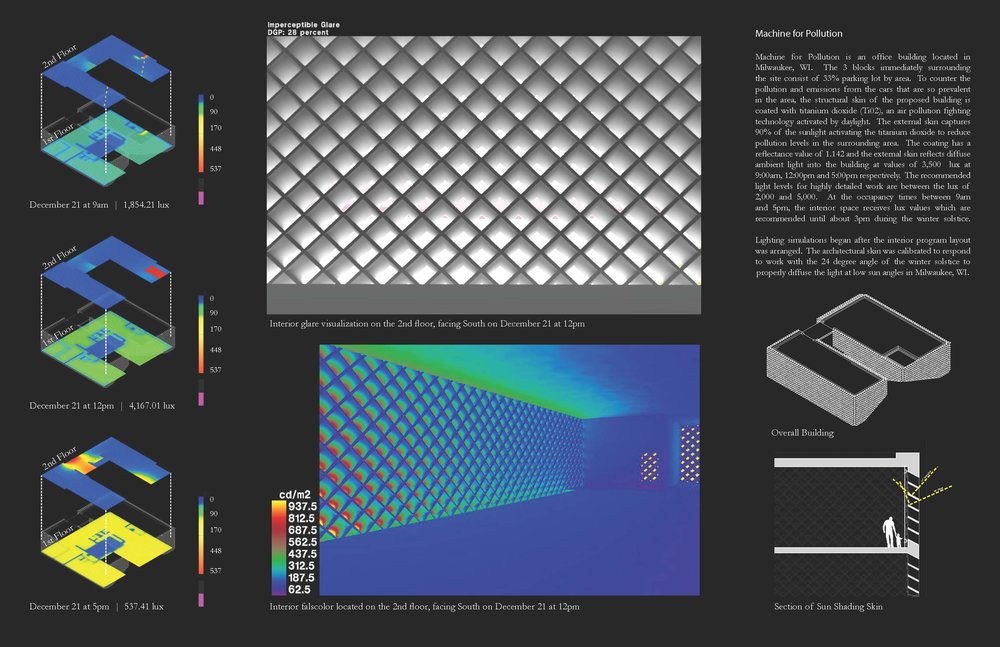
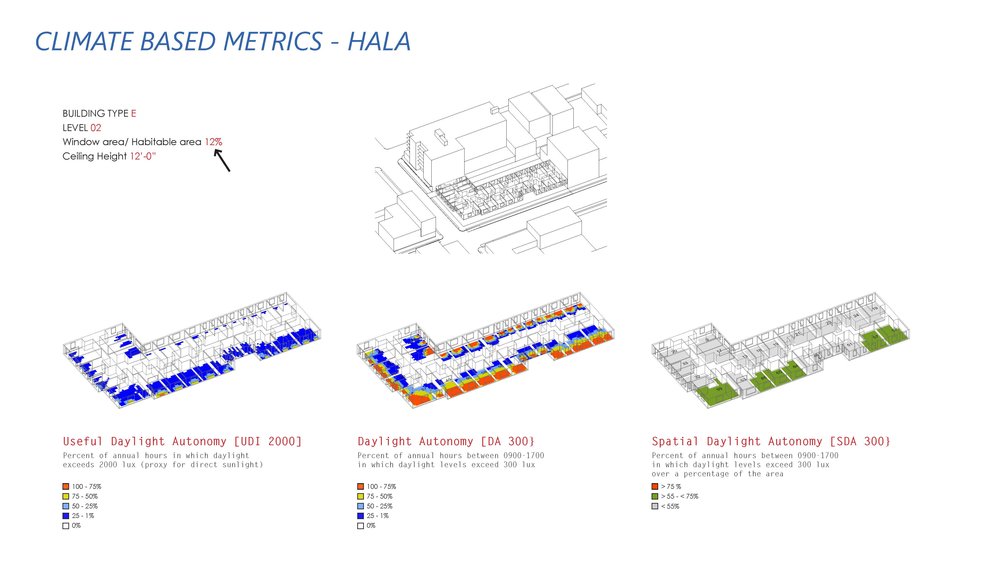
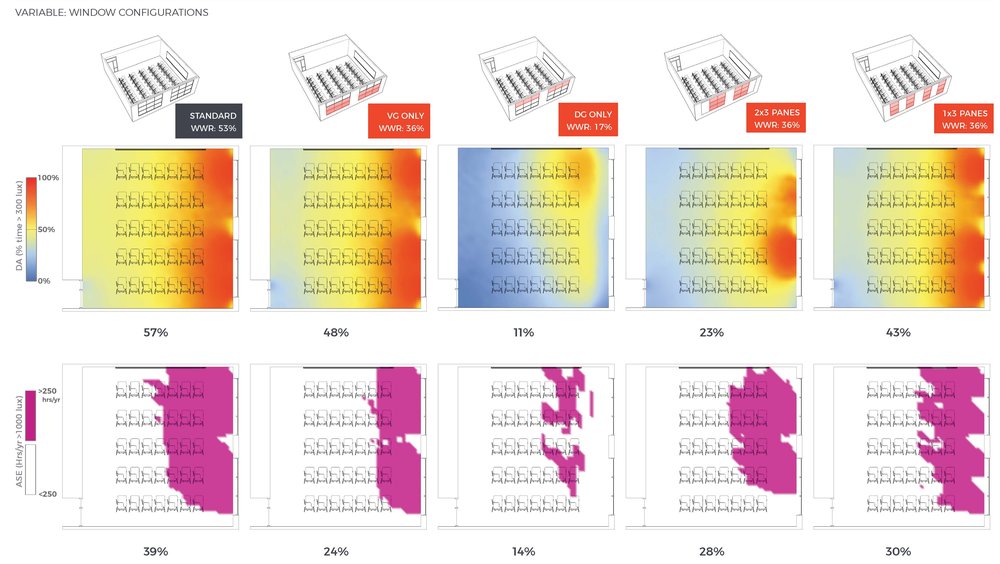
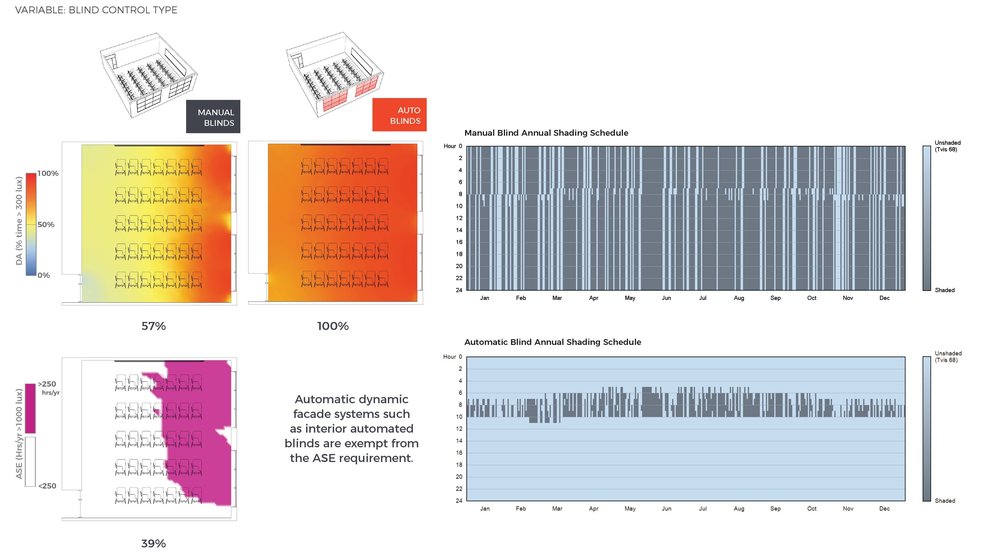
Lastly, we compiled spatial ASE and sDA results for each case. Superimposing the floorplan onto these results helps to clearly communicate how light levels and especially glare levels (through the proxy metric of ASE) could affect students, and provides a more tangible counterpart to the metric-driven visualizations.

Most importantly, what did you learn from the investigation? How did simulation and its outputs influence the design of the project?
The extent to which orientation determined achievability was one key takeaway from the process. We learned that interior parameters such as surface reflectivity can only go so far, but strategic, climate-oriented shading strategies are almost mandatory to achieve LEED v4 thresholds for all but north-facing classrooms. This wasn’t a revelation, but the study helped to reinforce and illustrate exactly why that’s the case and that there are real benefits beyond LEED to doing so.