PROJECT INFORMATION
Submitted by: Elliot J Glassman, Associate
Firm Name: WSP Built Ecology
ASHRAE Climate Zone: 1A
Building/Space Type: Office
Who performed the simulation analysis? External Energy Consultant
What tools were used for the simulation analysis?
-
Grasshopper Honeybee
-
DIVA for Grasshopper
What tools did you use to create the graphic?
-
Excel
-
Adobe InDesign
What phase of the project was analysis conducted? Design Development
What are the primary inputs of the analysis? Material reflectance and thermal properties, various toplighting options, internal loads
What are the primary outputs of the analysis? sDA, ASE, DGP, EUI
PROCESS
List the investigations questions that drove your analysis process.
Can we bring top lighting to a below grade office space while managing the climate’s high angle sun and strong solar radiation? What are the different possible design directions that would work for both daylight and energy performance? What is the impact of different alternatives on daylight, visual comfort, and energy? Are there trade-offs or synergies between daylight and energy performance?
How was simulation integrated into the overall design process?
This study was conducted on the project during early design development. The design team had wanted to bring daylight to a below grade office space through a lightwell and toplighting. The initial proposal for the toplighting was a large, centralized horizontal skylight. Our building performance team expressed concern that this would introduce a great deal of direct sun to the space because of the high sun angles in the climate, imposing unwanted solar loads and greatly increasing the risk of glare.
Simulation was brought into the process to illustrate the concerns as well as propose alternative toplighting approaches that could successfully daylight the space while reducing solar loads and glare. The goal was not to restrict the design but demonstrate a variety of alternatives that would work, giving the design team the flexibility to choose the approach that they felt was compatible with their design intent.
A reference case was created with no toplighting that would have only the lightwell to provide daylight but would perform well in terms of energy relative to the toplit alternatives. In addition to the horizontal toplight design, we proposed alternative design approaches such as a louvered shading system over the toplight to diffuse sunlight, a north facing monitor, and smaller monitors distributed across the space. Within each design direction, we look at three different parameters which varied by scheme such as the VLT of the glass for the unprotected skylight, louver angle for the shaded skylight, or the area of glass for the monitors.
How did you set up the simulation analysis and workflow?
We utilized the power of Grasshopper to perform the simulation analysis on all the alternatives. Each of the toplight schemes were preprogrammed into the script along with the parameterized variable we wanted to explore within each scheme.
The simulation was set up to run daylight, glare, and energy analysis for each alternative and output images of the results with unique file names referenced to the scheme. The simulations were connected so that the daylight analysis would inform the lighting schedule used in the energy simulation.
In traditional modelling approaches, you may need to coordinate inputs across multiple models to make sure you are getting an apples to apples comparison of alternatives. In our workflow, the geometry was parametric so we had one model where our inputs for material properties, thermal constructions, and internal loads were entered once and remained constant through each iteration. The only thing that varied was the lighting schedule which was automatically generated by the daylight performance.
How did you visualize the results to the design team? What was successful about the graphics that you used to communicate the data?
Looking at multiple alternatives can produce a great deal of outputs. We wanted to balance being able to understand the relative performance of each alternative at a glance with the ability to dig deeper into the metrics if desired.
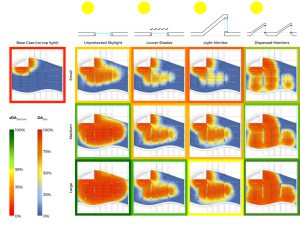
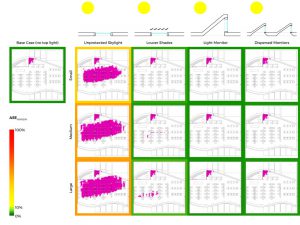
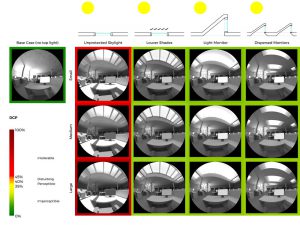
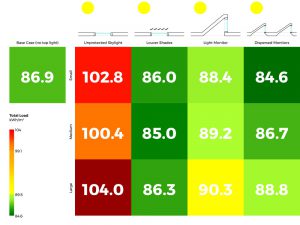
We conceived of the result visualization as a matrix for each of the metrics. Each cell of the matrix contained the visual output of the simulation and the border of each cell was color coded based on the result to give a quick indication of the performance. Grasshopper helped us assign the colors based on gradients so that we could look at the performance of the alternatives both relative to each other and against fixed performance thresholds.
Based on the color coding, it was clear that while the unprotected toplight appeared to be well daylit, it was actually letting in too much direct sun, negatively impacting visual comfort and energy.
![]()
Most importantly, what did you learn from the investigation? How did simulation and its outputs influence the design of the project?
The interesting conclusion illustrated by the study was that there were a number of schemes that performed better in terms of energy than the reference case without a toplight since the daylight reduced the lighting load and subsequently the cooling load as well.
This meant that there was not a trade off we needed to make between providing daylight or good energy performance. Rather, by sensibly managing the way that daylight entered the building, we could provide a well daylit and comfortable indoor environment for the occupants while reducing energy consumption.
There were a number of different alternatives that performed well giving us some flexibility to choose based on aesthetic or constructability criteria.