PROJECT INFORMATION
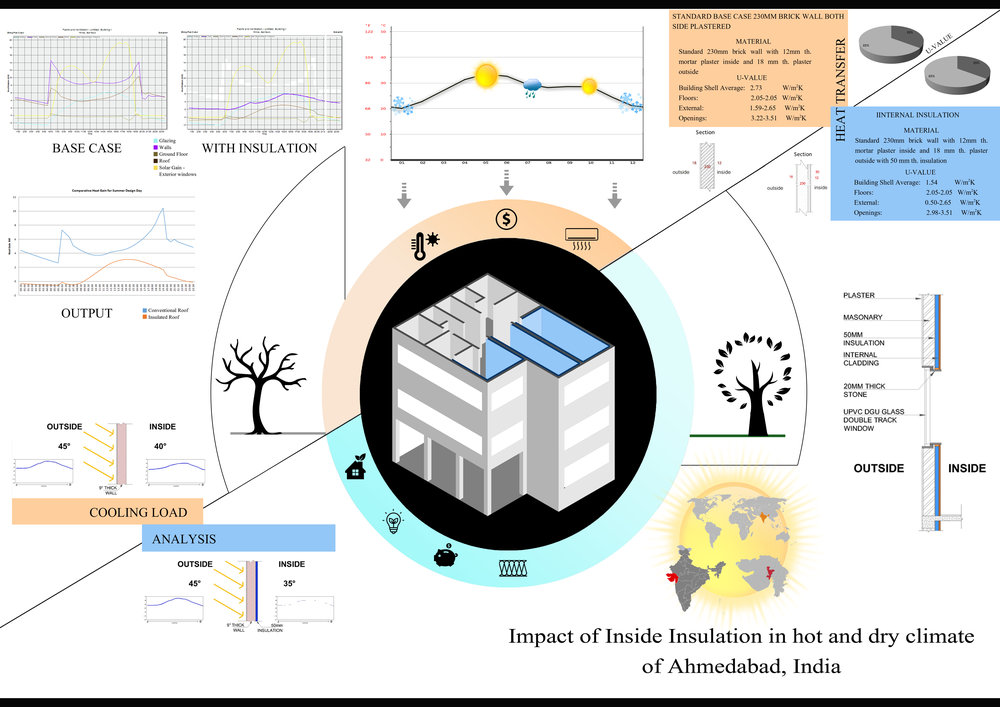
Graphic Name: What is the impact of internal insulation on overall heat gain of the building?
Submitted by: Shilpi Anand
Firm Name: NA
Other contributors or acknowledgements (optional)
What tools did you use to create the graphic?
-
Ecotect
-
Design Builder
-
Climate Consultant
-
Adobe Photoshop
What kind of graphic is this? Scatter Plot
Primary Inputs: u-value
Primary Outputs: heat gain
GRAPHIC INFORMATION
What are we looking at?
This graphic explains the conventional envelope as compared to applying internal insulation on the surfaces. We have tried to capture the comparison of before and after in a single graphic.
How did you make the graphic?
We thought of explaining a single thing which has changed the heat gain of the building envelope and eventually reducing the cooling load required for cooling the space. Applying insulation was essential as the facade was south oriented capturing maximum amount of heat across the year..
What specific investigation questions led to the production of this graphic?
How to reduce the heat gain on the front facade exposed to maximum heat?
How does this graphic fit into the larger design investigations and what did you learn from producing the graphic?
We tried to narrow down one important thing of the entire project which had maximum impact and crucial for decision making.
What was successful and/or unique about the graphic in how it communicates information?
It is successful in explaining without insulation and with insulation impact at the same time.
What would you have done differently with the graphic if you had more time/fee?
If we had more time, we could elaborate and labeled things more differently


