PROJECT INFORMATION
Graphic Name: What is the impact of building massing on daylight potential and renewable energy potential?
Submitted by: Elliot J Glassman
Firm Name: WSP Built Ecology
Other contributors or acknowledgements (optional)
What tools did you use to create the graphic?
-
Diva for Grasshopper
-
Adobe InDesign
What kind of graphic is this?
Primary Inputs: Three massing strategies for the site, the neighboring context, a WWR and VLT of the glass on the facade
Primary Outputs: Daylight autonomy of the floor plates and annual PV production potential of the roof surfaces
GRAPHIC INFORMATION
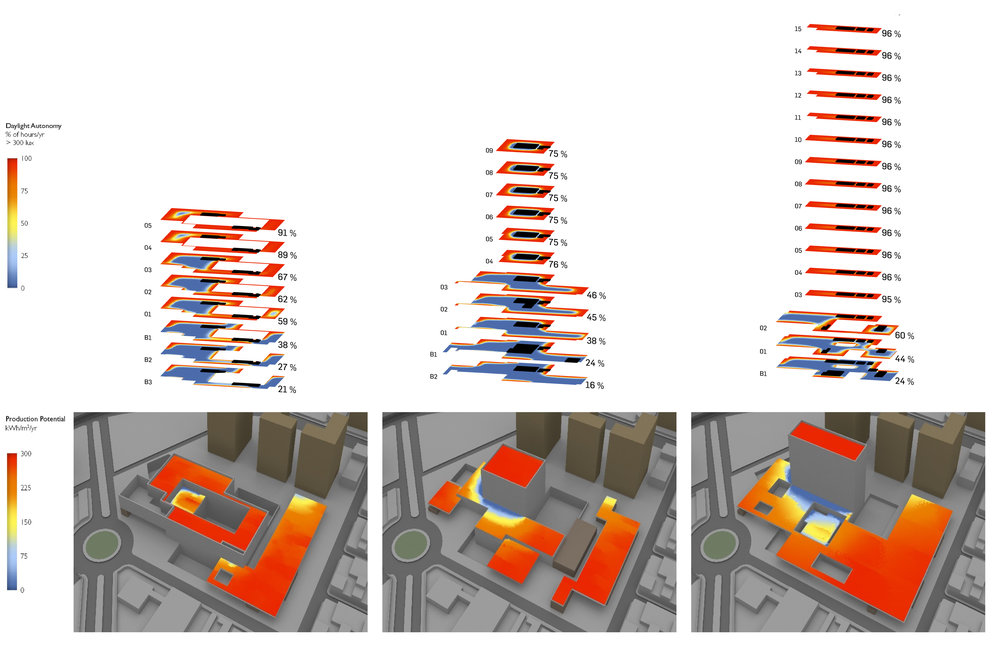
What are we looking at?
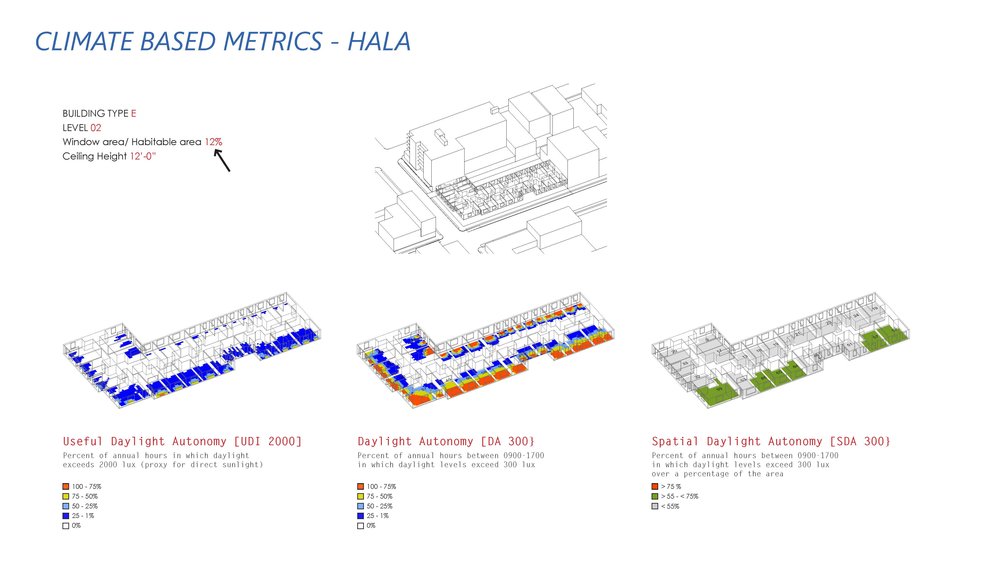
The graphic shows an exploded axonometric of for each of the three option of the floor plates generated and the amount of daylight autonomy potential there is.
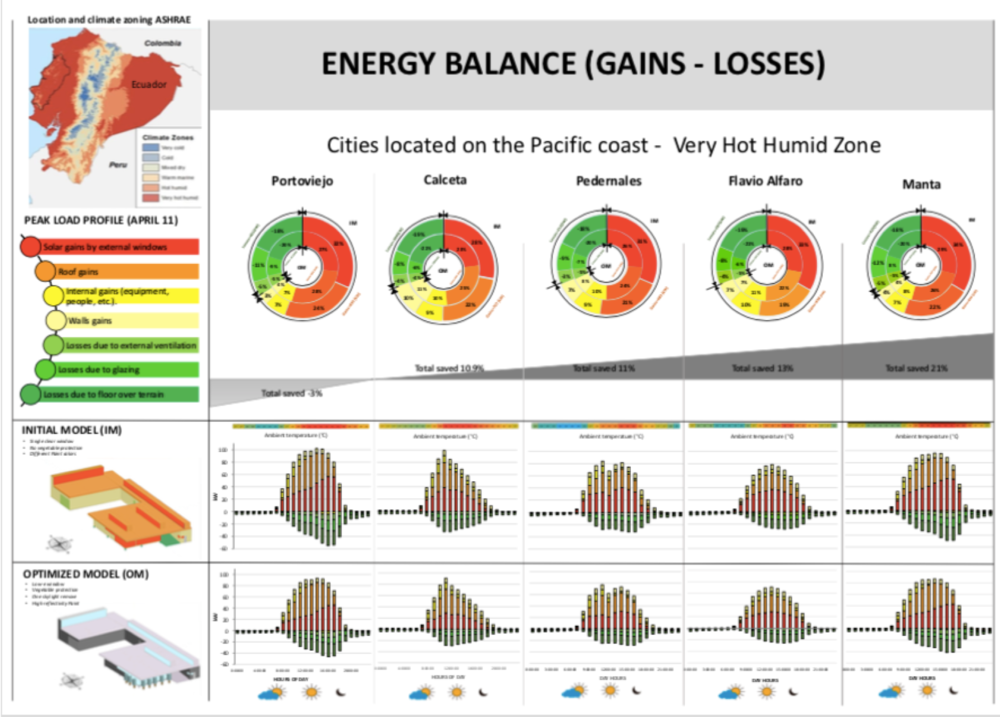
The images down below show all the massing options in context with the amount of solar radiation falling on the horizontal roof surfaces as a way of determining PV potential in an urban environment.
How did you make the graphic?
We used Grasshopper scripting to run the simulations and generate the exploded axonometrics. The rendered results were then composited in InDesign.
What specific investigation questions led to the production of this graphic?
The study was performed at a concept stage when the design team was considering multiple massing options. These studies created a performance-based criteria for evaluating the potential performance of each option and informing subsequent development of the design.
We created a Grasshopper script to divide the massing into floor plates and assign a specified window to wall ratio to the facade. We ran an annual daylight analysis on the models and a solar radiation analysis on the roof to see which option would offer the greatest daylight and renewable energy potential. The results also informed programming decisions and where massing or facade parameters should be tweaked to improve performance.
How does this graphic fit into the larger design investigations and what did you learn from producing the graphic?
The goal is to use performance modelling to inform the design process. The study the created this graphic was a way to introduce performance based feedback into the earliest architectural decisions. In this case, the decision was which site approach to pursue.
What was successful and/or unique about the graphic in how it communicates information?
The graphic is pretty simple and spatially informative. In both the daylight and renewable energy studies, it clearly indicates areas that are performing well and areas that are not. This gives the design team information at an early design stage that allows them to base subsequent decisions on.
What would you have done differently with the graphic if you had more time/fee?
Made the relationship of the massing to the exploded axon a little bit more integrated.