PROJECT INFORMATION
Graphic Name: What is the impact of climate and ubication on the energy balance of an initial model versus an optimized model of customer service agencies?
Submitted by: Luis Godoy
Firm Name: NA
Other contributors or acknowledgements (optional) Sebastian Romero, Andrea Lobato-Cordero, Geovanna Villacreses and Cristian Espinosa. Instituto Nacional de Eficiencia Energética y Energías Renovables.
What tools did you use to create the graphic?
-
Design Builder
-
Climate Consultant
-
Excel Adobe
-
Photoshop
-
Meteonorm
-
ArcGis
-
Power Point
What kind of graphic is this?
Primary Inputs: Average per hour of meteorological information, geographical ubication, initial and optimized architectural models.
Primary Outputs: Overall and hourly energy balance (gains-losses) for an extreme climate conditions day.
GRAPHIC INFORMATION
What are we looking at?
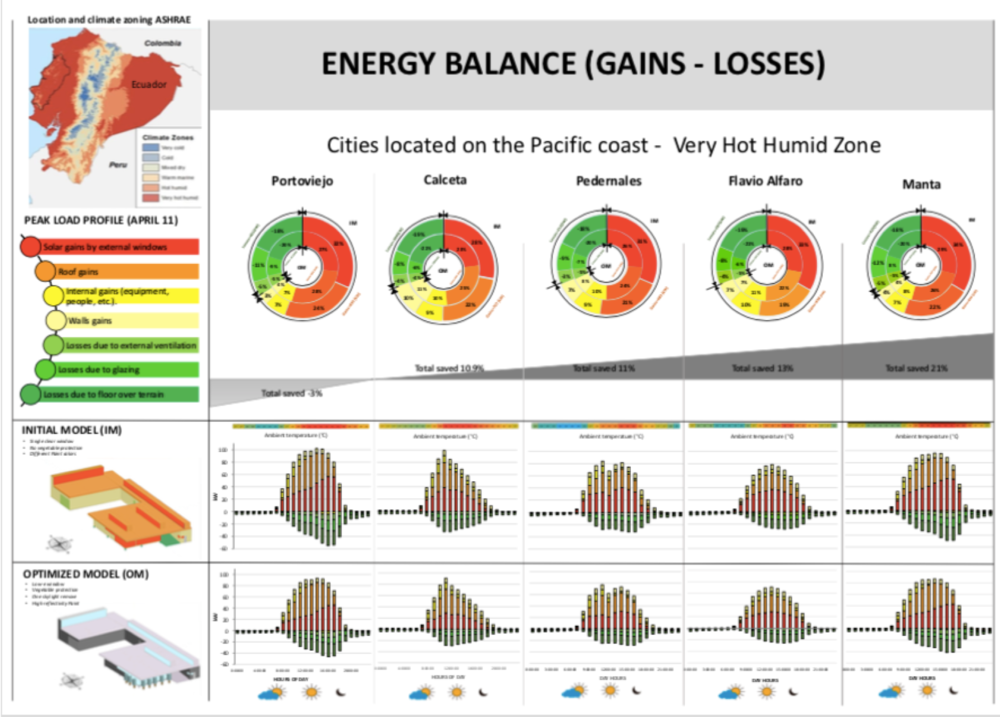
This graphic shows how is the energy balance (loses and gains) established, for buildings that will work as customer service agencies, to be built in affected areas by the 2016 earthquake in Manabi, Ecuador. Firstly, a weather condition study was carried out by using data of a typical meteorological year of the cities were the building will be located (Pedernales, Manta, Flavio Alfaro, Portoviejo and Calceta). From this information, the most probable hottest day of all cities was selected (April 11th). An initial model (IM), offered by the contractor, was compared with an optimized model (OM) that uses passive strategies for design. The energy performance, from the simulation, of the building with its IM and OM was analyzed, always considering the building functioning requirement such as: space, distribution, usage, etc. The set strategies must be replicable and show energy savings in all the cities. The total energy balance showed in the donut charts indicates the characteristic thermal gains and loses throughout the building materials according to their type. Even though Manabi corresponds to the ASHRAE climatic zone known as “humid very hot” each one of the agencies shows a particular behavior in which the inner temperature increased at afternoon hours due to the typical weather conditions. As first result, the solar gains on windows and roofs are representative, this is why the usage of efficient windows and reflective paint on roof and walls, is proposed. The second result of the bar plot indicate he hourly behavior of loses-gains. The internal gains on external windows on afternoon hours can be relieved by accurately orientated vegetation. Besides, it is possible to note that, for loses, these are grater on ground floor, which is a cooling advantage. Finally, it is possible to conclude that in most cases, energy savings are found after passive strategies of design were implemented, on all four cities. Portoviejo city was a special case because heat loses were diminished.
How did you make the graphic?
Firstly, with the coordinates of the five cities were the agencies will be place, through Meteonorm, the .epw (energy plus weather) files were generated, for the typical meteorological years (TPM) that will be used for weather study and energy simulation. With this data, the agencies were ubicated on ArcGis to confirm whether the cities are located on the same climate zone. Simultaneously, the weather study was carried out with Climate Consultant for each city. The day that showed the greater gains on the building was selected. The input data entered on Design Builder included: climate conditions, agencies characteristics IM and OM proposed. With the energy simulation, the hourly results of gains and loses were obtained, in .csv format. The analysis and calculations obtained were plotted as donut and bar charts by using Excel. The showed graphs were edited on Adobe Photoshop for a better display. After that, the final display was diagramed with the analisis content.
What specific investigation questions led to the production of this graphic?
– Which are the main energy gain and loss, as product of climate conditions, for a building model of customer service that will be built on affected areas by the earthquake in Ecuador? – How great is the energy saving that can be obtained by optimizing the initial model with the implementation of passive strategies for design, on the hottest day of the year? – How is the energy balance established and what aspects must be considered to optmize the IM?
How does this graphic fit into the larger design investigations and what did you learn from producing the graphic?
In Ecuador and other countries, it is proposed the construction of buildings with similar facilities and services to satisfy the customer demands. Besides, the buildings must be replicable in different locations. These buildings can be constituted by companies such as: banks, restaurant franchises, payment agencies, customer services, etc. Nevertheless, the influence of the energy and thermal behavior of the building is not considered. This is why it is important that prior the construction, efficient passive strategies on the design are analyzed and proposed, in order to obtain energy savings. The lessons learned were: though a climatic zone can be normalized (for instance, humid very hot), the characteristic weather of the area can affect differently each zone even if they are near to each other. The energy balance is a simple and useful analysis that allows to detect and prioritize sensitive zones of the building to energy gain or lose.
What was successful and/or unique about the graphic in how it communicates information?
From the geographical location, the climate conditions and architectural characteristics of the building, it is possible to obtain the hourly and total energy balance, to detect energy saving opportunities in each city. In this case, it was observed that windows and roof are sensitive zones for heat gain, for this reason, their intervention must be prioritized to obtain greater energy savings. By using window and wall protection and specific paints (that do not increase considerably the final budget), effective energy savings can be obtained in all the agencies in the studied cities.
What would you have done differently with the graphic if you had more time/fee?
Firstly, we will try to find a correlation between the geographical location of every building and the energy consumption, considering the meters above sea level in which the building is located. Also, we would like to try or to combine other passive strategies for instance: external ventilation and/or ventilation on floor over terrain. Furthermore, we will monitor the energy consumptions of the building before, during and after its construction, to corroborate implemented the design strategies.
Great contribution
awesome investigation!
Awesome investigation