PROJECT INFORMATION
Graphic Name: What is the impact of shading on the cooling load?
Submitted by: Daniel Ruepp
Firm Name:
Other contributors or acknowledgements (optional)
What tools did you use to create the graphic?
-
IDA ICE
What kind of graphic is this? Peak Loads / Spatially Integrated
Primary Inputs: Drop arm awning
Primary Outputs: Maximum cooling load per zone
GRAPHIC INFORMATION
What are we looking at?
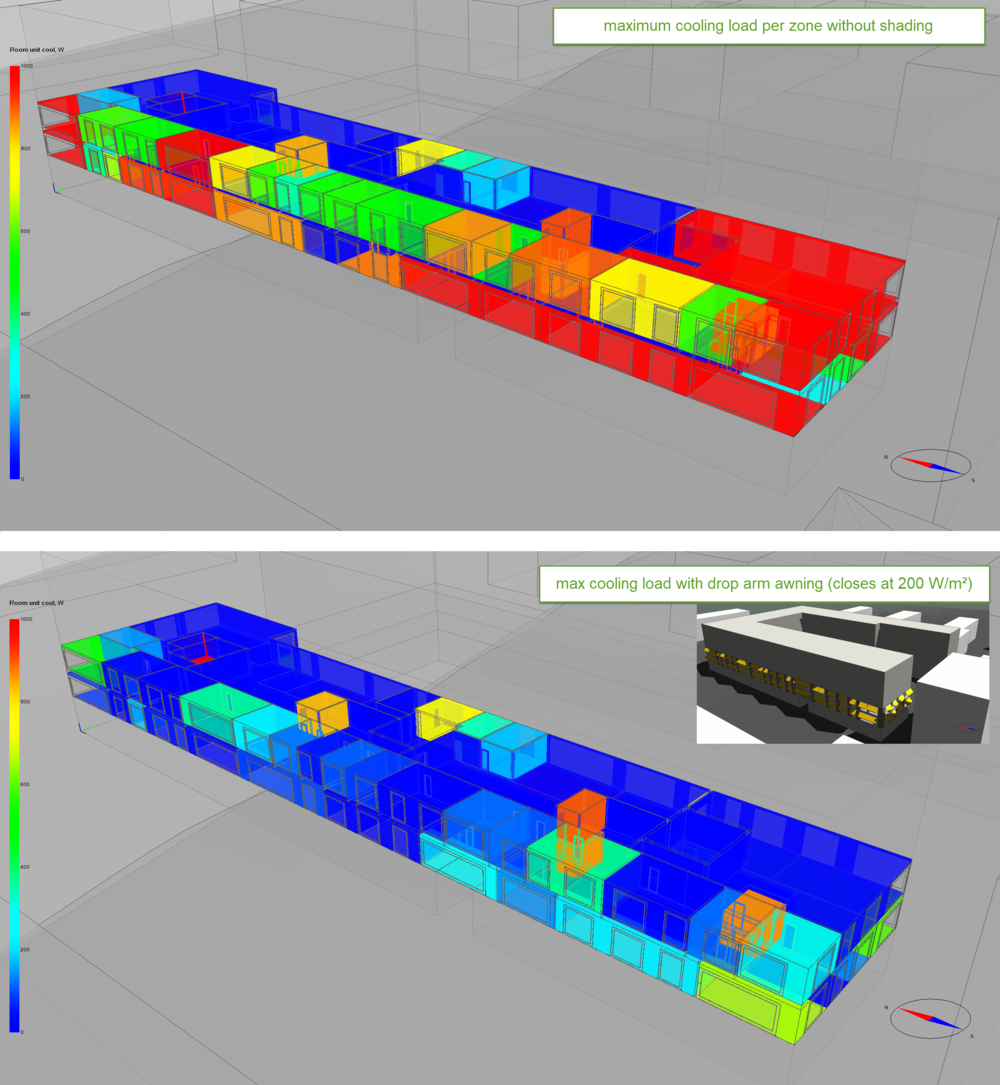
The top graphic shows the results of a cooling load simulation of a 70 zones office building without solar shading. Red means the needed power is above 1 kW.
The bottom graphic shows the same building, but with drop arm awnings on the south and west facade closing at 200 W/m² solar radiation.
How did you make the graphic?
Screen grabs from IDA ICE and put together in Snagit 11 + added text
What specific investigation questions led to the production of this graphic?
In which rooms do we need more than one cooling panel (with 1kW peak)?
What is the impact of drop arm awnings on the peaks?
How does this graphic fit into the larger design investigations and what did you learn from producing the graphic?
The plan for this building was to install cooling panels with 1 kW maximum power. It was necessary to identify the peak rooms and how big the influence of drop arm awnings would be.
What was successful and/or unique about the graphic in how it communicates information?
You see on first sight that the loads were lowered drastically in the critical zones.
What would you have done differently with the graphic if you had more time/fee?
Better alignment