PROJECT INFORMATION
Graphic Name: What is the impact of operable glazing fraction on thermal comfort and natural ventilation potential?
Submitted by: Carl Sterner
Firm Name: Sefaira
Other contributors or acknowledgements (optional)
What tools did you use to create the graphic?
-
Sefaira
-
Adobe Photoshop
-
SketchUp
What kind of graphic is this? Scatter Plot
Primary Inputs: Building geometry (zoned) with glazing; location (weather file); envelope properties, internal conditions, and HVAC parameters.
Primary Outputs: Comfort: % occupied hours within setpoint range (dry bulb temperature). Free area: the ratio of operable window area to floor area for each zone, measured against a target of 5%.
GRAPHIC INFORMATION
What are we looking at?
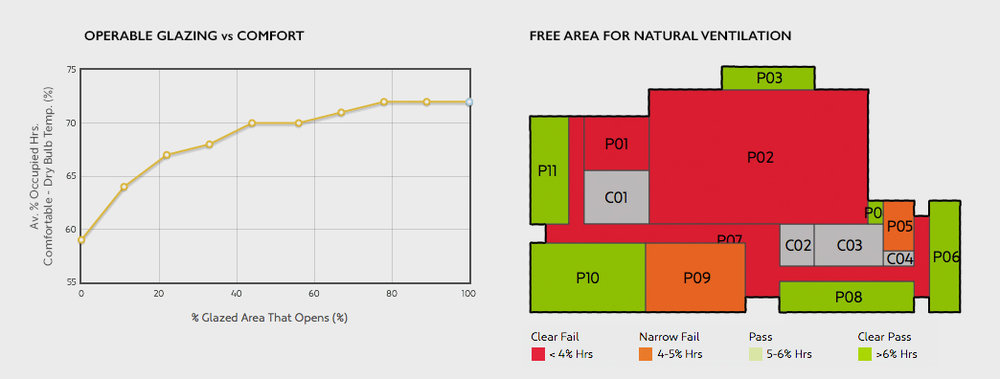
The graphic is showing two pieces of data relevant for determining the optimal amount of operable glazing for natural ventilation. The first chart (on the left) shows the impact of increasing operable glazing on predicted thermal comfort (the percent of occupied hours with dry bulb temperatures within setpoints). Thermal comfort improves until approximately 75% of glazing is operable, and tops out at 72% of occupied hours being comfortable. The second graphic (on the right) shows the current design’s “free area” — the ratio of operable window area to floor area for each zone. A free area of 5% is a typical target value for naturally ventilated buildings, and has been codified in standards such as BREEAM in the UK and Title 24 in California. This graphic shows that a number of the building’s zones fail to meet this prescriptive criteria as currently designed. Taken together, the graphics indicate that more operable glazing is needed in many of the zones in order to provide good natural ventilation.
How did you make the graphic?
-
Modeled building geometry in SketchUp
-
Uploaded the model to the Sefaira web application
-
Set up the various simulations (envelope, internal conditions, and HVAC parameters)
-
Ran a Response Curve for Operable Glazing %, looking at the impact on Thermal Comfort. Exported the resulting graphic.
-
Ran a Free Area assessment, with a target of 5% free area. Exported the resulting graphic.
-
Combined the two graphics in Photoshop
What specific investigation questions led to the production of this graphic?
-
Is there enough operable window area in each zone to provide good natural ventilation?
How does this graphic fit into the larger design investigations and what did you learn from producing the graphic?
This graphic was combined with other analyses related to the window area, related to daylighting and solar gain. The purpose of these combined investigations was to evaluate whether the glazing strategy and facade design was effective from energy, daylight, and natural ventilation perspectives. The initial glazing ratios were fairly conservative, and the analyses showed that the design would benefit from more glazing in many of the zones, for both natural ventilation and daylighting.
What was successful and/or unique about the graphic in how it communicates information?
The graphic summarizes and clearly presents fairly complex analysis, making the results actionable. It is easy to see how operable glazing affects comfort, and where the problem areas are in the existing design.
What would you have done differently with the graphic if you had more time/fee?
More clearly connected to two graphs, perhaps by finding a way to put them both in terms of absolute glazing area. The Response Curve is currently terms of % of glazing that is operable, while the Free Area chart is currently based on operable glazing area. This makes it difficult to clearly relate the two.