PROJECT INFORMATION
Submitted by: Lei Fu – Senior Associate
Firm Name: KGM Architectural Lighting
Other contributors or acknowledgements: Francis Mekhail / Roxanna Bailey
ASHRAE Climate Zone: 3A
Building/Space Type: Office
Who performed the simulation analysis? Lighting Designer
What tools were used for the simulation analysis?
Rhino – DIVA
Grasshopper DIVA
What tools did you use to create the graphic?
Adobe Illustrator
Adobe InDesign
Adobe Photoshop
What phase of the project was analysis conducted? Schematic Design, Design Development, Construction Documentation
What are the primary inputs of the analysis? Daylight Autonomy and Maximum Daylight Autonomy
What are the primary outputs of the analysis? Percentage of floor area that meets target illuminance with original design, compared with percentage of floor area that meets target illuminance with improved design
PROCESS
List the investigations questions that drove your analysis process.
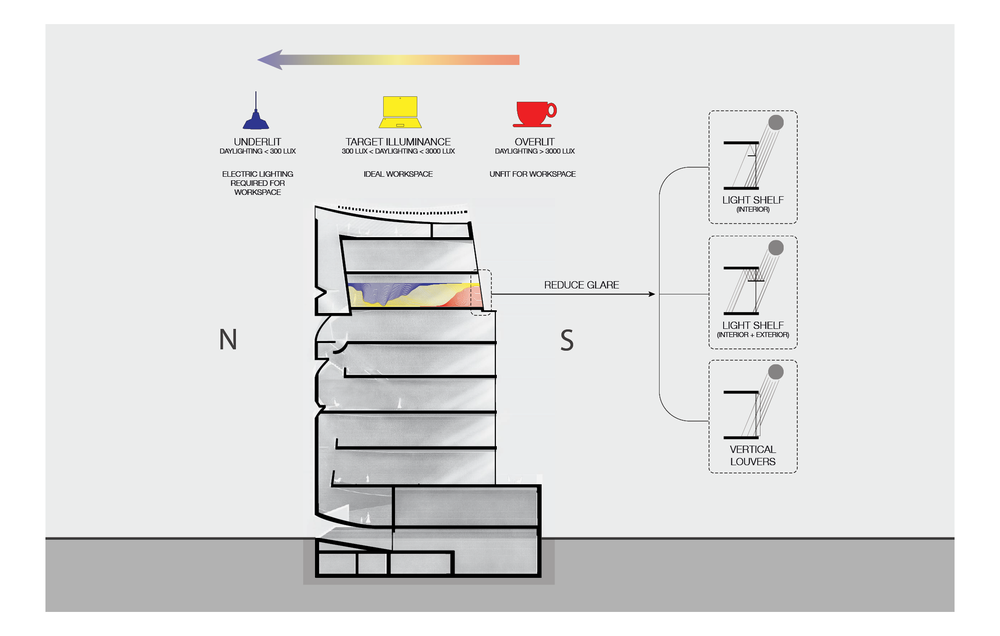
Our project is located in a high density neighborhood and the main entrance is from the street to the northwest. The main facade is solid with random cuts, while the back facade, facing southeast, is floor to ceiling glazing. As a result, our primary challenge were: How can we reduce the glare from the southeast facade without cutting too much useful daylight? How can we utilize daylighting simulations to optimize the balance between quantity and quality of natural light? Which facade strategies are most effective in decreasing glare?
How was simulation integrated into the overall design process?
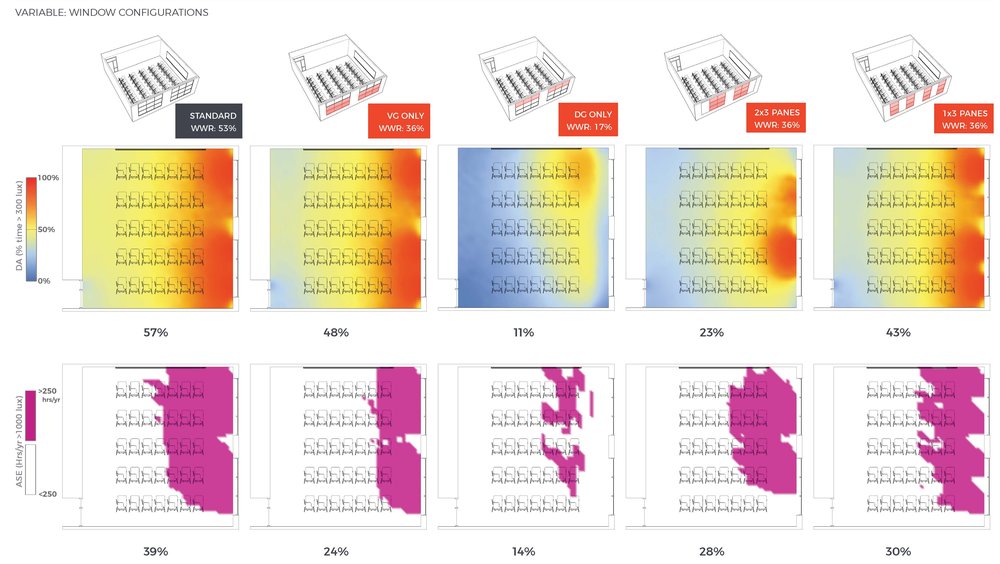
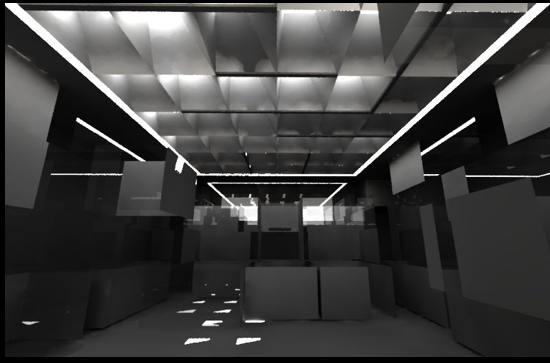
We performed radiance HDR rendered videos, daylight autonomy (DA) studies and maximum daylight autonomy (DA.max) studies. The DA and DA.max studies are the primary evaluation matrix we used to determine the lighting quantity and quality of the space. We determined that spaces with high DA.max values are over lighted and are not appropriate to be used as workspace, while spaces with low DA values are under lighted and require electric lighting to be used as workspace. We presented our findings to the architect, who then reconceptualized some aspects the southeast facade based on our daylighting analysis.
How did you set up the simulation analysis and workflow?
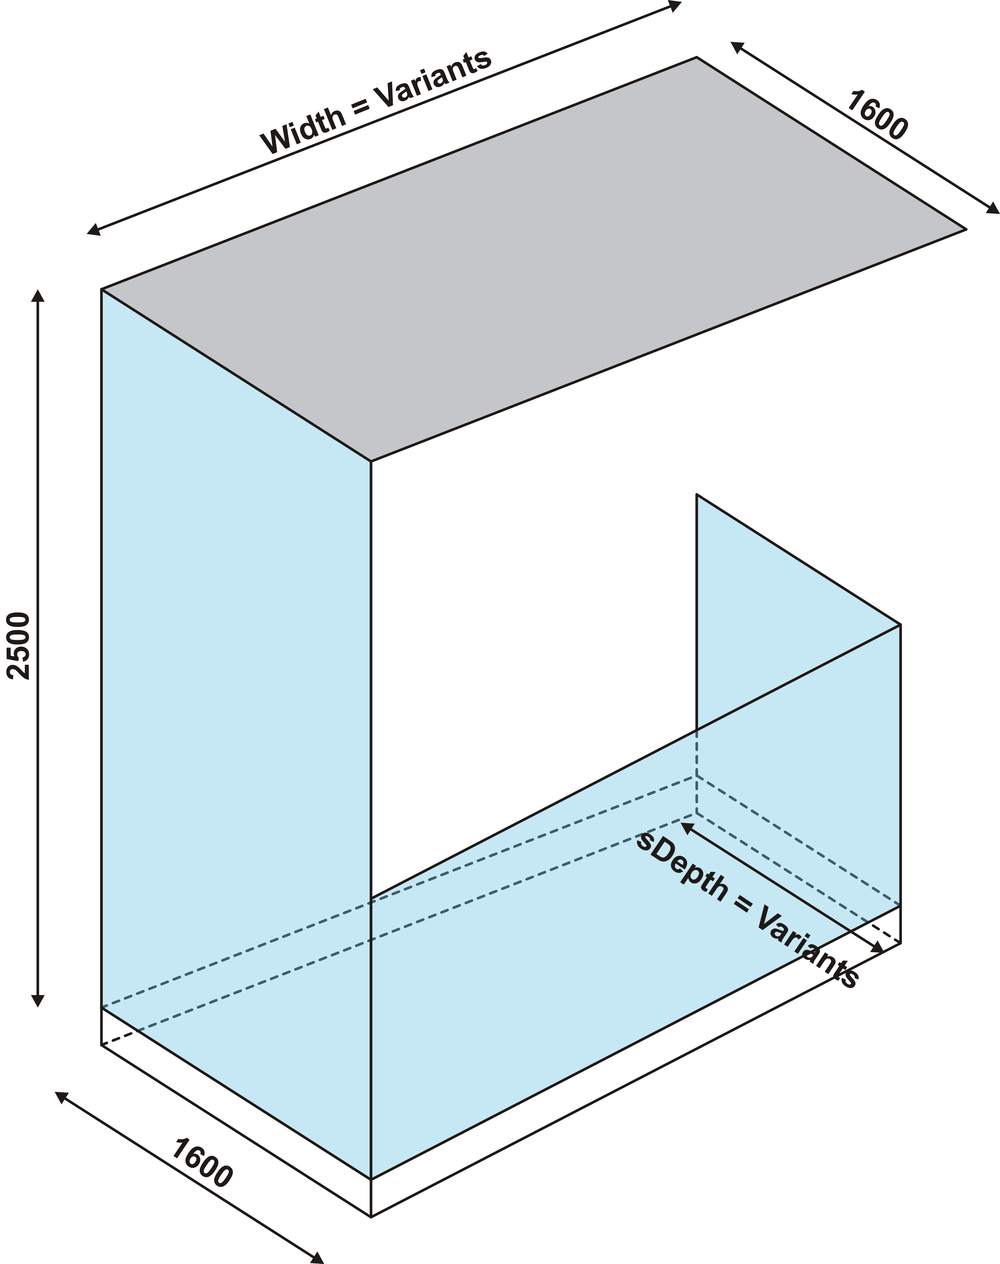
The simulation was set up through a series of steps starting with Revit. The Revit model, provided by the client, was exported to Rhino for analysis and simulation. Revit layers were cleaned up in Rhino making the application of materials through DIVA a more seamless process. The specific epw (weather data) was downloaded and applied to the “application” portion of the simulation. Nodes were then placed (distance of sampling node: .76, distance between calculation nodes: .45) on each floor. Materials were applied according to the architects direction and, finally, metrics were defined. Prior to the simulation, grasshopper was used to investigate the sun path over the site. We initiated a series of shadow studies and developed a facade strategy for testing. Metrics: Daylight Grid-Based > Climate-Based > Metric: Daylight Autonomy, Occupancy Schedule: 8 to 6 (office space), Target Illuminance: 300 Lux. We tested a series of facade strategies until we established target metrics that were satisfied.
How did you visualize the results to the design team? What was successful about the graphics that you used to communicate the data?
Output focused on a series of graphic representations paired with diagrams. We first defined DA and DA(max). We communicated the significance and impact on the exterior facade strategy and interior programming. Through the use of diagrammatic sections we were able to explain our approach and walked the design team through the output of each facade strategy. We relied heavy on the Adobe suite (Illustrator, Photoshop and InDesign) to create a clear narrative for presentation.
Most importantly, what did you learn from the investigation? How did simulation and its outputs influence the design of the project?
The simulation allowed us to determine which areas of the building should be reorganized programmatically based on daylight. It also enabled us to quantify the cost/benefit of proposed facade strategies on the quality of natural light in the space. With the information from our simulation, the architect reprogrammed the space to include more amenities on the southeast side of the building, where glare is most prominent. The architect is exploring facade strategies to help mitigate the glare we observed in our studies.
Would it be possible to get in contact with the author due to thesis research? Very interesting case study.
Thanks a million