PROJECT INFORMATION
Submitted by: Ajit Naik
Firm Name: Baumann Consulting
Other contributors or acknowledgements: Kreuck + Sexton Architects, Thomas Phifer and Partners, Yuna Zhang & Oliver Baumann – Baumann Consulting
ASHRAE Climate Zone: 5A
Building/Space Type: Mixed Use (Retail)
Who performed the simulation analysis? External Energy Consultant
What tools were used for the simulation analysis?
-
Design Builder + Eplus
-
BuildSimHub
What tools did you use to create the graphic?
-
Excel
-
Adobe InDesign
What phase of the project was analysis conducted? Conceptual Design
What are the primary inputs of the analysis? WWR, U-Value
What are the primary outputs of the analysis? Whole-Building (Site) EUI
PROCESS
List the investigations questions that drove your analysis process.
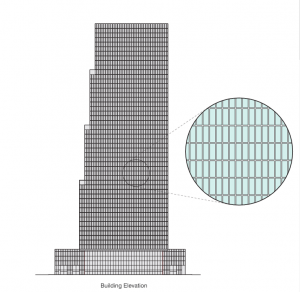
What is the required glazing thermal performance to ensure energy code compliance for different high-rise curtainwall window to wall ratios?
How was simulation integrated into the overall design process?
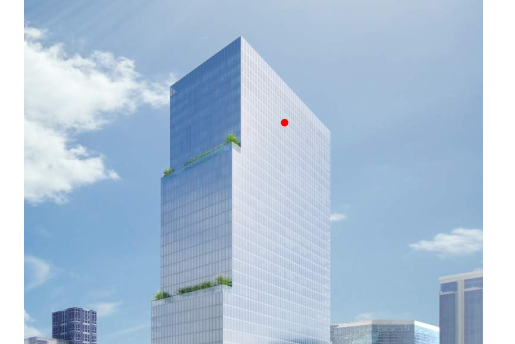
Prospective tenant requests for panoramic views prompted the high-rise project development team to prioritize a high window-to-wall ratio (WWR) of 80%. The current Chicago Energy Conservation Code, which references 2015 IECC (and so ASHRAE 90.1-2013) requires high-WWR projects to demonstrate energy performance better than a baseline with prescribed 40% WWR, U-0.42 window assembly U-Value, SHGC-0.40 window solar heat gain coefficient, and U-0.055 wall U-Value . To meet this goal, high-WWR projects must employ envelope or system performance improvements to offset increased glazing heat loss relative to the baseline.
The design team recognized that code compliance through demand reduction via envelope improvements could be more cost-effective than through subsequent consumption reduction via HVAC efficient systems, and wanted to understand the aesthetic façade design implications. Having selecting an aggressive SHGC-0.26 target at project outset to reduce required cooling equipment capacity, the project team integrated simulation to establish a feasible combined WWR and curtainwall assembly U-value target.
The study parametrically analyzed combinations of WWR and U-value ranging from 35-85% and U-0.22 – U-0.42. The study identified code baseline performance and WWR-U-Value pairs resulting in code-compliant performance without system efficiency improvements; this information informed preliminary façade cost estimation prior to MEP systems design. By testing and presenting a wide range of possibilities in response to a design query about specific design concepts, integrated simulation offered the design team feedback on future potential concepts in addition to those under consideration.
How did you set up the simulation analysis and workflow?
The simulation team set up a simplified core-perimeter energy model in DesignBuilder with all WWR, envelope (except SHGC-0.26 glazing), HVAC, lighting, and domestic hot water performance parameters set at code baseline efficiencies for systems described in the preliminary concept package. The team exported the IDF file from DesignBuilder and uploaded to BuildSimHub for cloud-based batch manipulation and execution. BuildSimHub functions created IDF files, executed simulations, and reported whole-building energy usage intensity (EUI) for each possible combinations of WWR and U-value spanning 35-85% at 5% intervals and U-0.22 – U-0.42 at U-0.02 intervals, respectively. Site energy performance was selected as the single simulation output for comparative analysis to understand the cost of meeting energy code via improved façade U-value alone.
How did you visualize the results to the design team? What was successful about the graphics that you used to communicate the data?
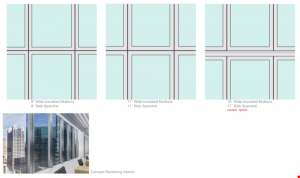
The preliminary strategy involved a simple table to list the curtainwall assembly U-value meeting code baseline energy performance for each WWR option tested. Though this method indicated maximum allowable insulation levels, it provided solely static value targets. The design team wanted to visualize the full range of compliant combinations with aesthetic context, and so employed a graphic-based strategy. An excel graph with curves depicting EUI vs WWR for multiple glazing assembly U-values allowed the design team to identify code baseline EUI and draw a horizontal line representing the cutoff for compliant (below the line) and non-compliant (above the line) WWR-U-Value combinations. Simultaneously, the original table was represented visually as colored overlays representing required U-Value on several of the team’s façade concepts. This dual strategy targeted both data-focused and experiential-focused design team members.
Most importantly, what did you learn from the investigation? How did simulation and its outputs influence the design of the project?
The combined visualization scheme proved to be an effective strategy for achieving an energy code compliant façade. Rather than developing and modeling efficiency packages to accommodate a given façade, parametrically analyzing the full set of façade design options maximized simulation impact and minimized design workflow and timeline interruptions. Visualizing the entire dataset together with colored façade options afforded the design team flexibility and the ability to quickly predict code compliance for preliminary concept modifications without waiting for further analysis results. The design team ultimately selected a façade option with 68% WWR that featured sections of floor-to-ceiling glass, ensuring high-quality views, and a feasible U-0.26 glazing assembly, ensuring energy code compliance prior to inclusion of high-efficiency MEP systems.