PROJECT INFORMATION
Submitted by: Alen Mahic, Amir Nezamdoost, Kevin Van Den Wymelenberg
Firm Name: Energy Studies in Buildings Laboratory – University of Oregon
ASHRAE Climate Zone: 4B
Building/Space Type: Office
Who performed the simulation analysis? University
What tools were used for the simulation analysis?
-
OpenStudio + Eplus
-
Design Builder + Eplus
-
Radiance + custom scripting
What tools did you use to create the graphic?
-
R
-
Adobe Photoshop
What phase of the project was analysis conducted? Design Development, Construction Documentation
What are the primary inputs of the analysis? Daylighting model, energy model, blinds operation algorithms, and AMY/TMY weather data.
What are the primary outputs of the analysis? Blinds operation schedules, blind movement and occlusion metrics, Hourly daylighting performance, spatial Daylight Autonomy and Annual Sunlight Exposure, Lighting schedule, hourly energy analysis, Annual energy end use, Non-energy benefits of automated blinds, Blind life cycle cost analysis
PROCESS
List the investigations questions that drove your analysis process.
What are the effects of manual and automated blinds on annual and point-in-time daylight performance, and energy end use? How can we leverage the simulation data to predict occupant productivity and absenteeism? What is the payback period of automated and manual blind systems?
How was simulation integrated into the overall design process?
This study was conducted on a mid-rise large open plan office during late design development to investigate the relative differences in operation patterns and resultant annual energy and daylighting performance between manual and automated system. Designers and building owners were interested in reducing the cost of shading systems by opting for manual blinds where automation might not be necessary.
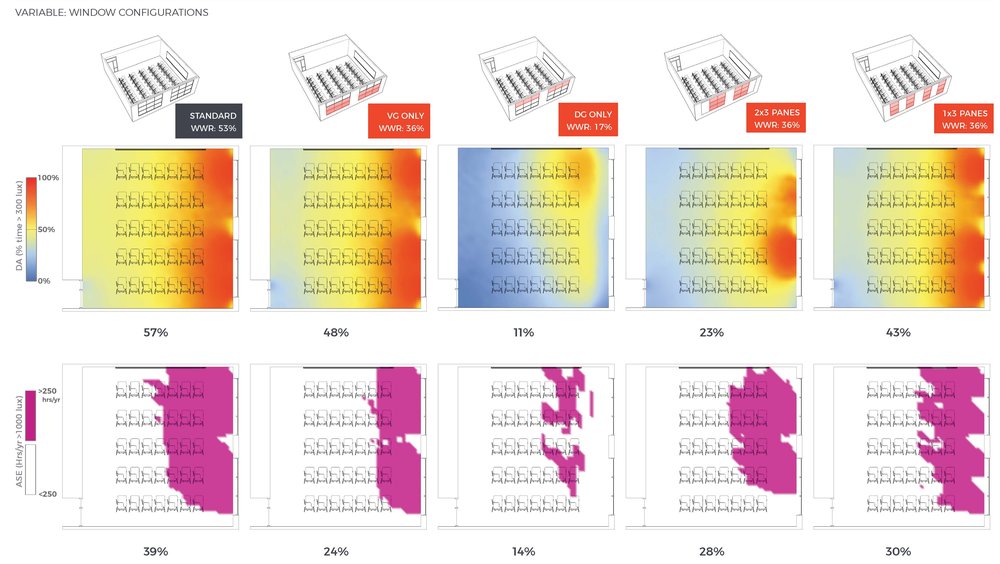
Per facade blind performance analyses showed that northwest, southwest and southeast facades would benefit from automated systems by managing direct sunlight, and reducing interior glare. The lowest ASE value is recorded in northeast zone with total 5.75% (minimum=4.91% for January) while the highest ASE percentage is reported in southwest zone with total 41.72% (maximum=68.13% on December), following by southeast (26.59%) and northwest (23.53%) zones.
These findings confirm that northwest, southwest and southeast facades do benefit from automated controls while the northeast facade showed ASE value, which is low enough where manual blinds would be sufficient to control direct sunlight and minimize interior glare. However, the monthly ASE values reveal that there is still an excess of direct sunlight during summer months (12.68%), and there is an equivalent annual average number of blinds movements between the northeast (2.76) and northwest facades (2.72).
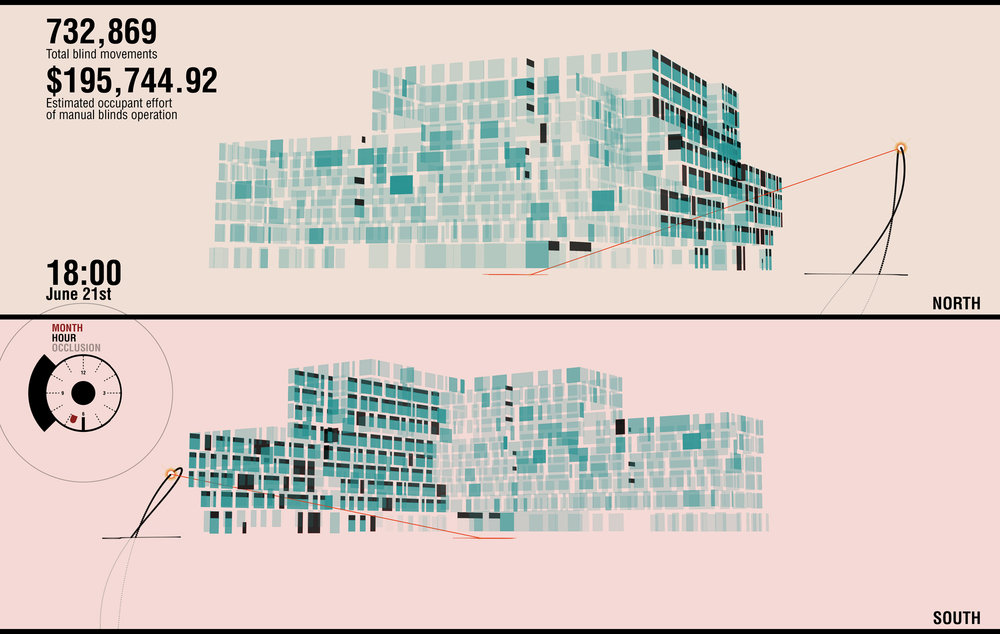
Moreover, we found that the payback period of automated blind system is lower (9.5 years) when compared to the fully manual alternative (16 years).
How did you set up the simulation analysis and workflow?
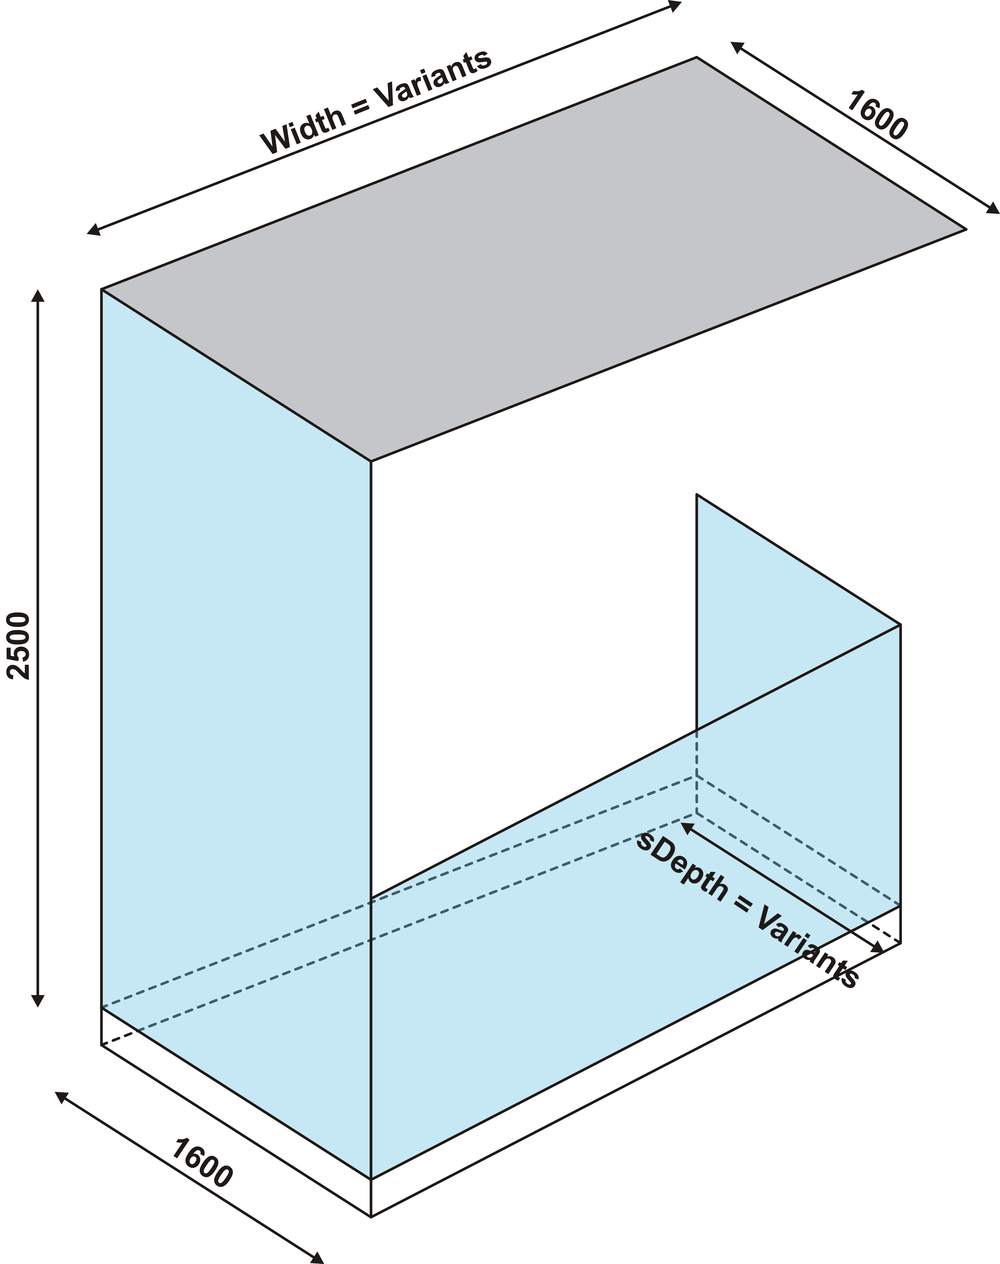
For annual climate-based daylight simulation, detailed digital interior models and relevant massing of surrounding buildings and site context were generated in SketchUp. When the model was completed and verified for accuracy against floor plans; it was exported to the RADIANCE daylight simulation engine. Rcontrib ambient calculations were used in RADIANCE to compute light source contributions. Materials and blinds were assigned to digital models based on the information from construction specifications using CIBSE surfaces and reflectance charts and bi-directional scattering and distribution functions (BSDF).
The Energy Management System (EMS) in EnergyPlus was used to create blind occlusion schedules. In order to calculate indoor horizontal illuminance for daylight sensing lighting control and creating the lighting/dimming fractional schedule, an overlaying procedure between EnergyPlus thermal zones and RADIANCE daylight zones was needed. We started with (1) EnergyPlus model including all the thermal zones, (2) a script-based analysis grid was generated based on four daylight zones in RADIANCE, (3) EnergyPlus thermal zones overlaid onto the RADIANCE analysis grid in order to isolate the illuminance grid points that fall inside the EnergyPlus thermal zone. These can be averaged, or a single point specified to generate the fractional lighting schedule, and (4) reconciling zone overlays in R-studio. This is a critical step to ensure accurate energy simulation of the interactive effects of daylight sensing electric lighting control.
Shade schedules were generated according to the combination of exterior illuminance data obtained from RADIANCE, plus horizontal profile angle from EnergyPlus.
How did you visualize the results to the design team? What was successful about the graphics that you used to communicate the data?
For blinds visualization we have annual results for 691 windows of the building, and needed a way to better understand and troubleshoot this data. R’s plotting functions allowed us to visualize individual window surfaces and their blinds positions in 3D space. This method proved as effective and efficient throughout the simulation phase. Consequently, it also became an effective way to communicate the data and our findings to the clients by showing it in a similar manner as it is observed on actual building facades. Lessons learned:
-
Different ways of making simulation data spatial and easier to understand and communicate.
-
Better understand blinds as they change over time, and the algorithms used to simulate their behavior as part of the design process.


Most importantly, what did you learn from the investigation? How did simulation and its outputs influence the design of the project?
The primary takeaway from this investigation confirmed our initial assumptions that the north-facing facades would require mitigation of direct sunlight, particularly in the summer and shoulder seasons where both sunrise and sunset hours introduce high potential of visual glare and heat gain discomfort. The daylighting analysis also provided data to inform the interior organization of partitions and work stations to minimize visual glare.
Additionally, this investigation allowed us to make relative performance comparisons among a variety of blinds operation algorithms to further understand the accuracy and reliability of specific simulation methods of complicated human behavior. This ultimately resulted in some of the more interesting visualizations showing the “haphazard” manual blinds algorithms contrasted against the uniform automated blinds algorithms. And on that note, we were also able to develop some interesting ways to process and visualize daylighting, energy, and blinds operation data that we can also utilize in future investigations.