PROJECT INFORMATION
Submitted by:
Jacob Dunn
Firm Name:
Eskew+Dumez+Ripple
Other contributors or acknowledgements:
Shawn Preau – Eskew+Dumez+Ripple Project Manager
Ian OCain – Eskew+Dumez+Ripple Desigern
Z Smith – Eskew+Dumez+Ripple Director of Building Performance and Sustainability
Project Name:
Southern-Style Labyrinth
ASHRAE Climate Zone:
2A
Building/Space Type:
Gym
Who performed the simulation analysis? (select all that apply)
Architect – Internal Sustainability Personnel
What tools were used for the simulation analysis? (select all that apply)
OpenStudio + EnergyPlus
What tools did you use to create the graphic?
Excel / Adobe Indesign
What phase of the project was analysis conducted? (select all that apply)
Design Development
PROCESS
List the investigations questions that drove your analysis process.
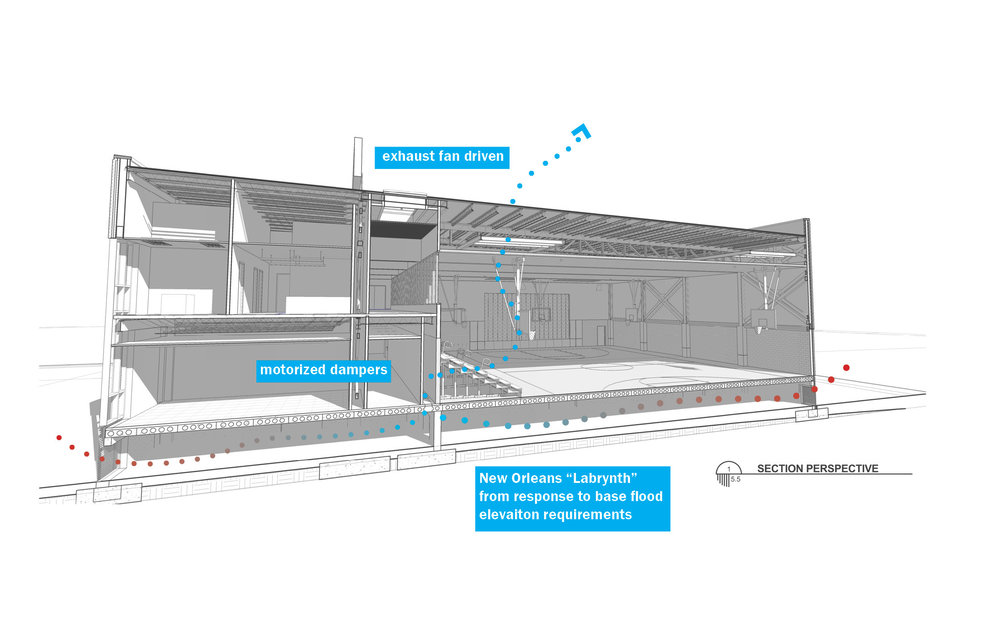
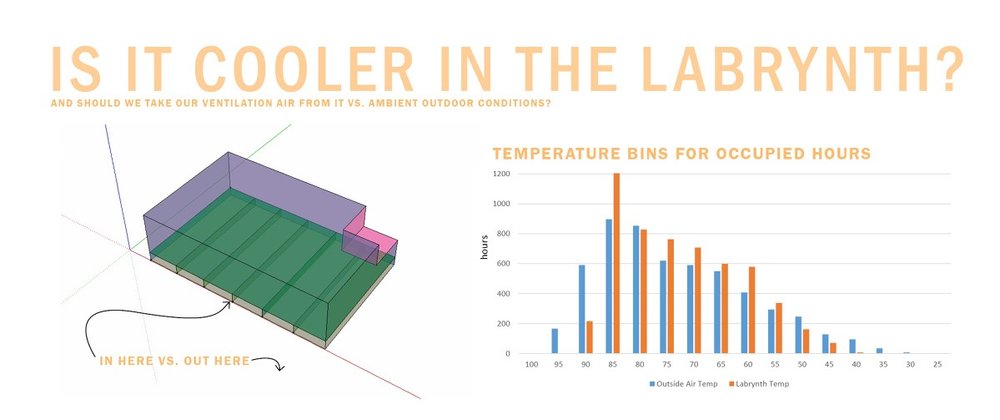
Is the air temperature in the thermal mass “labyrinth” cooler in the summer and warmer in the winter than the ambient outside air? How much so? How much heating and cooling energy could be saved by drawing air from the labyrinth using exhaust fans in the gym?
How was simulation integrated into the overall design process?
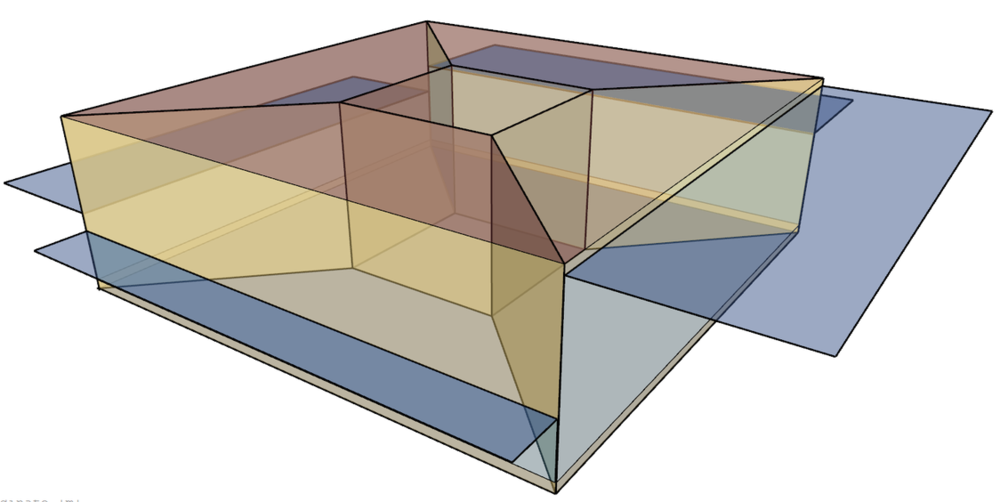
New projects in New Orleans typically share an interesting condition where they are raised 3’ up above the base flood elevation as required by FEMA. This creates a crawlspace condition which, when filled with concrete foundation walls, is similar to that of a thermally massive labyrinth. However, thermal mass passive strategies typically aren’t recommended for the New Orleans climate given its small diurnal swing, but drawing air from the crawlspace could still save energy. The question is, how much?
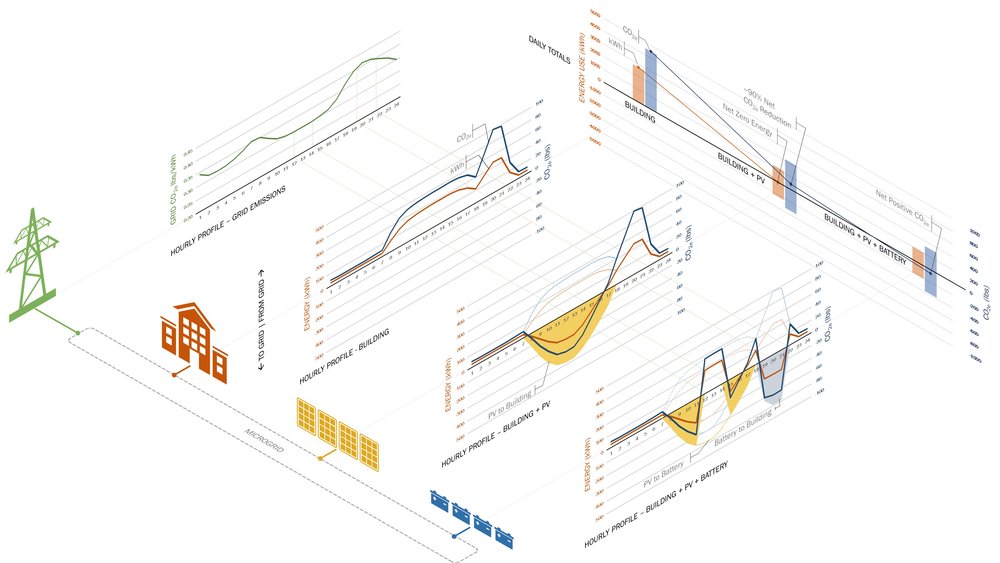
The project explored this idea during the design development phase, and designed a passive/active ventilation system that uses exhaust fans in the gymnasium to pull air through the crawlspace from underneath the bleachers through motorized dampers. The space is zoned separately from the rest of the HVAC equipment of the project, houses activities with wider comfort zones, and utilizes robust materials to withstand higher humidity levels. Simulation was used to understand how just how much energy this type of passive strategy could save.

How did you set up the simulation analysis and workflow?
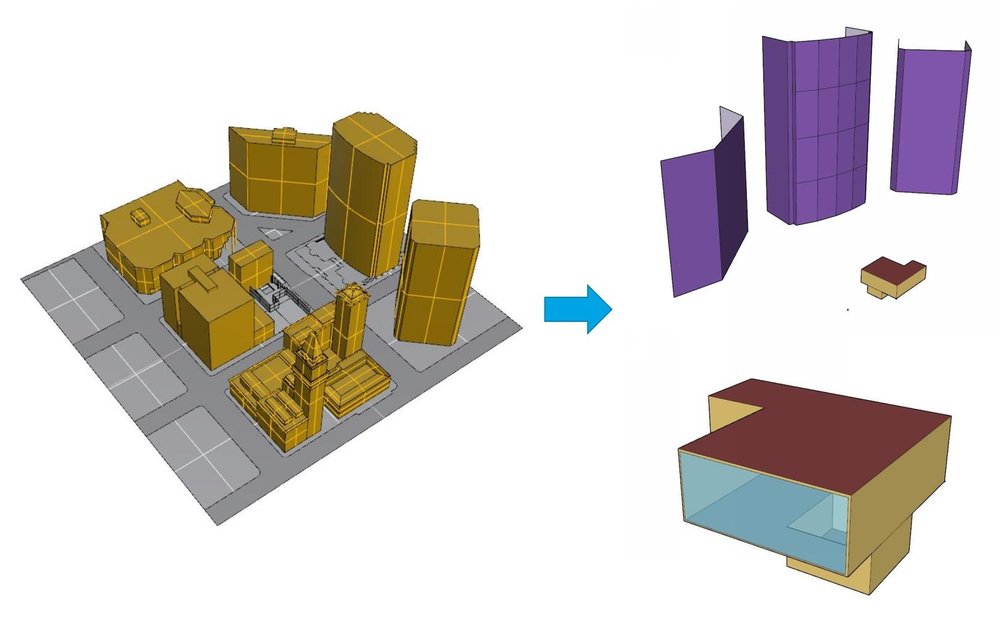
One goal of the analysis was to get an estimate of savings without using CFD, as the firm at the time did not have this capability. Thus, EnergyPlus was used for the simulation process. While the software is capable of providing bulk airflow calculations through its Airflow Network post-processing module, the team took a more simplified route. First, the team explored the difference in temperature between the crawlspace and outside air to determine if the magnitude was large enough to warrant further exploration. A rough air change per hour calculation was performed based on the inlets and outlets of the raised, vented crawlspace. This number was then input into EnergyPlus’s zone:infiltration object, which is then subject to pressure coefficients and wind patterns of the .epw file during annual simulation. Finally, the energy model was modified to take natural ventilation air from the crawlspace zone with the as-designed HVAC still available to makeup any load difference or to condition the space when temperature or humidity conditions were out of range. This provided a quick and adequate workaround to test the natural ventilation strategy without the use of CFD.
How did you visualize the results to the design team? What was successful about the graphics that you used to communicate the data?
While visualizing the data in this case study was fairly straightforward, the sequencing of when the data was communicated was key to pushing the design forward. The initial question was a gut check to see if there was a substantial difference between the temperature of the crawlspace and the outside air given the climate. Once quantified, we showed the data to the team in 3 ways.
1) histogram – this chart provided a good way to, at a glance, visually represent the difference in temperature bins between the pre and post labyrinth condition.
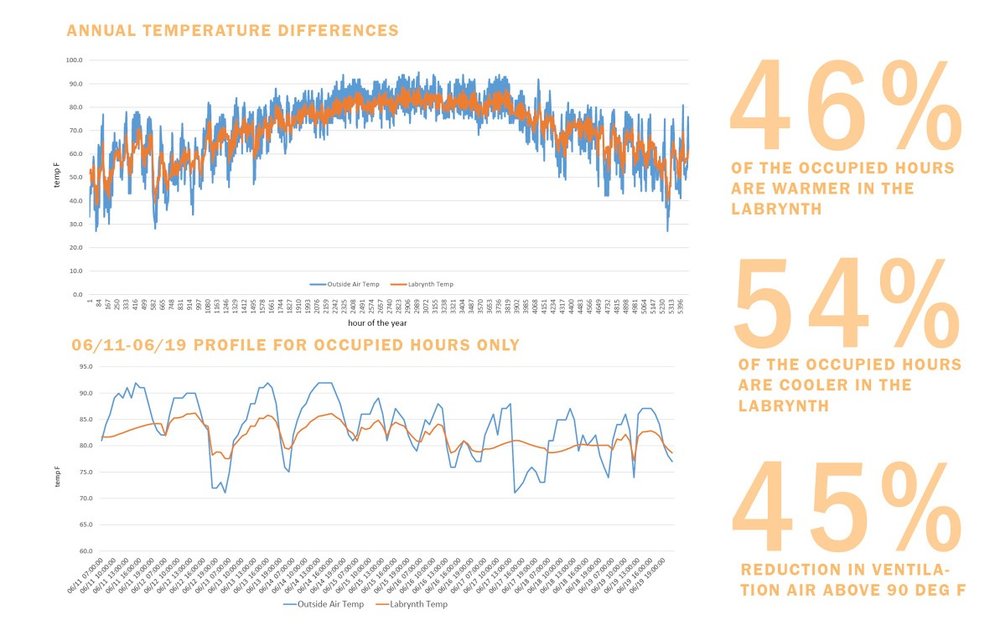
2) Line charts – The line charts aimed at visually representing the magnitude of temperature difference over time, but in a slightly less abstract way than the histogram. The annual chart is shown alongside a weekly profile, the former showing the sheer difference throughout the year, while the latter allows you to see the daily swing between the two approaches.
3) Value call outs – neither the histogram or line charts provides a single quantification of the effect of the labyrinth, so some analysis of the data was warranted. The % of hours warmer and cooler in the labyrinth during occupied times was calculated, along with the % reduction of hours of above 90 deg F.
This combination approach was successful in showing both the magnitude of difference between the two approaches, along with how often the labyrinth condition performed better than the outside air. The numbers showed that the strategy was promising, so we moved forward on defining the natural ventilation model and HVAC system to quantify the effect on both heating/cooling energy and overall energy.
Most importantly, what did you learn from the investigation? How did simulation and its outputs influence the design of the project?
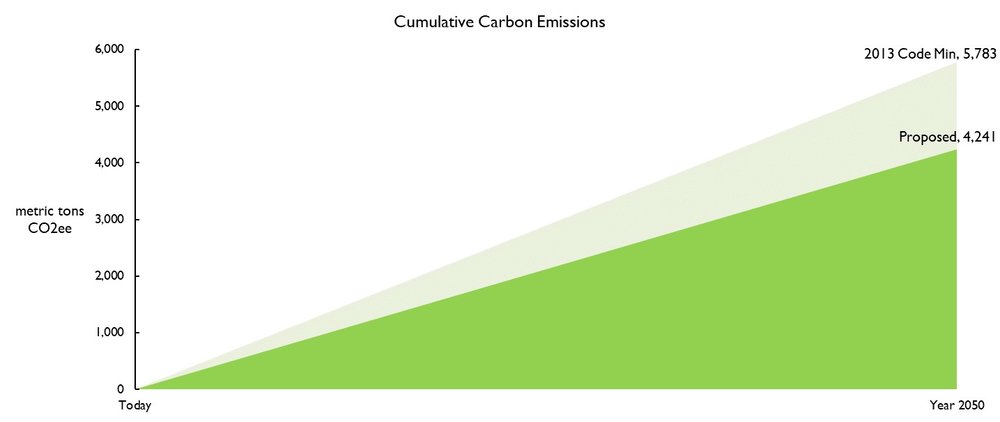
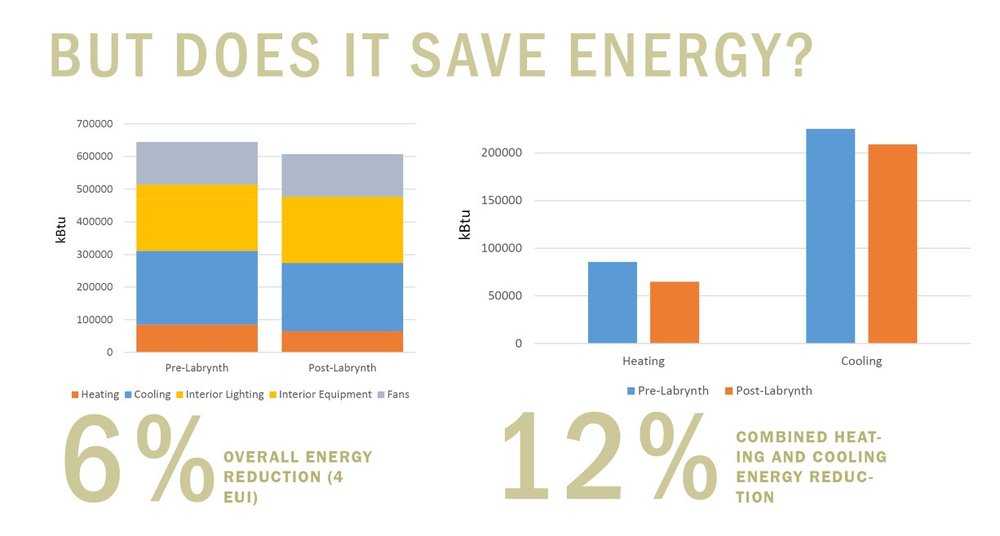
We learned that even in this climate’s hot and humid context, this type of pseudo-labyrinth could be promising from an energy efficiency standpoint. The simulation results showed that 12% of the heating and cooling energy could be saved using this type of passive measure, or 6% of the overall energy. This was a large enough difference for the design team to decide to move forward with integrating this move into the envelope, HVAC design, and mechanical sequence of operations. Advocating for this strategy to the MEP and owner took some convincing, so having the numbers, and more importantly the support of the design team, was critical in carrying the design intent into the construction documents. Additionally, this approach shows a synergy between resilience (flood protection) and energy efficiency (labyrinth) – a relationship often thought to be in opposition to one another.