PROJECT INFORMATION
Graphic Name: What’s the impact of glazing specifications on peak loads and energy consumption?
Submitted by: Rufei Wang
Firm Name: Harvard Graduate School of Design
Other contributors or acknowledgements (optional) Huishan He, Holly W. Samuelson, Panagiotis Michalatos
What tools did you use to create the graphic?
- Grasshopper Ladybug
- Grasshopper Honeybee
- Adobe InDesign
- Grasshopper – WinEnergy
What kind of graphic is this? Scatter Plot
Primary Inputs: Glazing U-value, Glazing SHGC
Primary Outputs: Peak load in W/m2 and energy use in kWh/m2
GRAPHIC INFORMATION
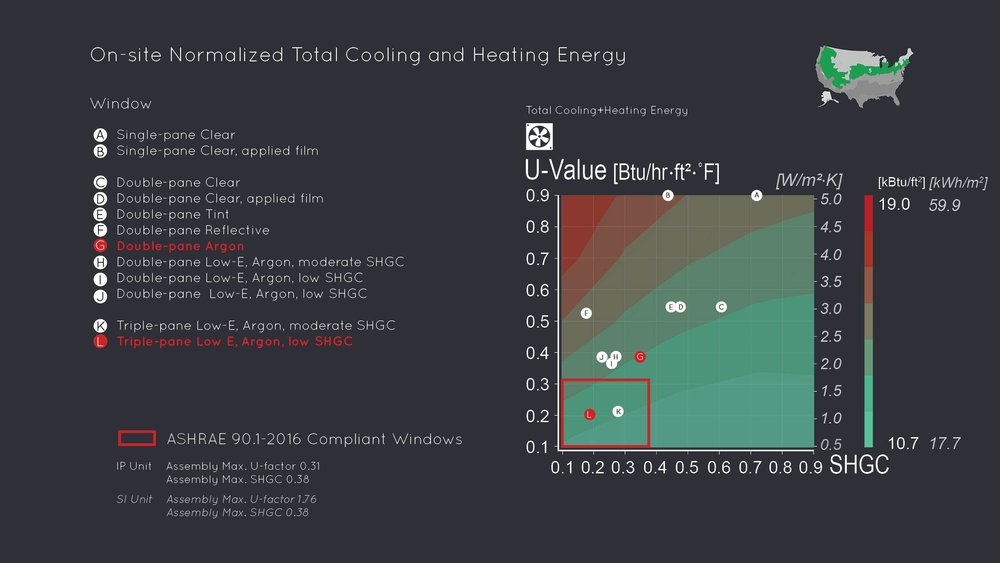
What are we looking at?
The graph provides energy performance results for the full range of possible window properties at one time for a given climate, building type and orientation. Vertical and horizontal axes plot U-value and SHGC respectively, the most important window properties in energy performance. Gradient colors represent normalized total heating and cooling energy, and each plot represents one window type. Users can plot window products, using SHGC and U values on the graph to compare their respective performances.
The colorstep value is 2 kBtu/ft2 [6.3 kWh/m2], meanings that window products falling in the same color area produce similar on-site normalized total cooling and heating results (i.e. within 2 kBtu/ft2 [6.3 kWh/m2]). Note: the heating and cooling values were produced from a full energy model of a perimeter zone. Thus, the values take into account the window, internal gains, and other comprehensive energy model inputs.
How did you make the graphic?
The graph is the visualization from our proposed window selection tool. We’ve created 14 Grasshopper components for parametric simulation and data visualization, the code is written in C# using Visual Studio Platform. The workflow is as follows: 1. Conduct parametric simulation using self developed components and Grasshopper – Ladybug & Honeybee components. 2. Post process the data using self developed components. 3. Make screenshot from the tool visualization and further annotated the graph in Indesign.
What specific investigation questions led to the production of this graphic?
Choosing from the multitude of available fenestration products remains challenging. The existing window selection methods have limitations. We are proposing a new parametric workflow and visualization to better integrate with the early-design process.
How does this graphic fit into the larger design investigations and what did you learn from producing the graphic?
The graphic is part of our research for proposing a new workflow for window selection. We’ve researched the shortcomings of existing methods for selecting windows. We believe that the ability to visualize the impact of full range of window properties could be a beneficial aid to the early design process. A parametric simulation-based methodology was proposed. During the research, we’ve focused on exploring methods to simplify window system modelling and to increase simulation speed while maintaining desired accuracy.
What was successful and/or unique about the graphic in how it communicates information?
The graph allows the users to view the energy results of the entire set of window choices (assembly U-factor and solar heat gain coefficient) and immediately recognize trends in their energy performance. Users can also plot window products of interest on the graph to compare their respective performances.
What would you have done differently with the graphic if you had more time/fee?
The tool visualization legend is automatically determined from the maximum result value and the minimum result value. The visualization does not provide the option to fix the legend ranges. It can create confusion when two graphs are put together for comparison.
One Reply to “What is the impact of glazing properties on peak loads and energy consumption? ”