PROJECT INFORMATION
Submitted by: Stefan Gracik
Firm Name: Integral Group
Other contributors or acknowledgements: Ken Takahashi, Neil Bulger
ASHRAE Climate Zone: 2A
Building/Space Type: Entertainment/Public Assembly Lodging/Residential
Who performed the simulation analysis? MEP Firm
What tools were used for the simulation analysis?
-
OpenStudio
-
Eplus
-
IES-VE
-
Grasshopper Ladybug
-
Grasshopper Honeybee
What tools did you use to create the graphic?
-
Excel
What phase of the project was analysis conducted? Schematic Design, Design Development
What are the primary inputs of the analysis? building envelope properties
What are the primary outputs of the analysis? HVAC load, standard effective temperature, predicted mean vote
PROCESS
List the investigations questions that drove your analysis process.
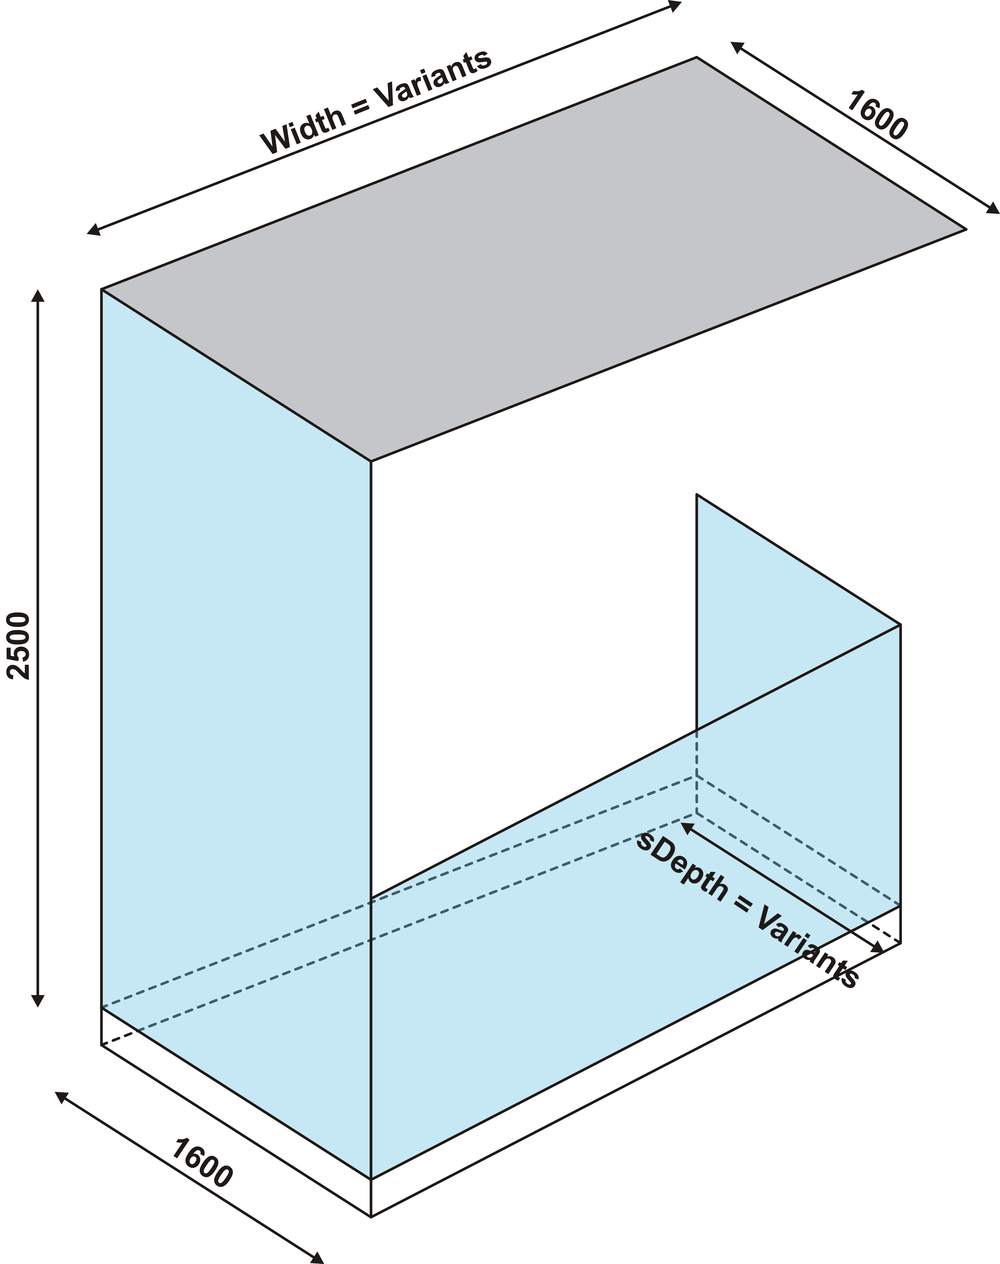
The client had very specific project requirements for this historic townhouse restoration. Essentially it's a new home hidden behind an existing townhouse facade. The new construction is to abut directly to the adjacent building on the east side, but the west side leaves a gap between the residence and the building next door. The historic facade is south of the new home, facing the street. A piece of cor-ten steel will be placed completely over the adjacent building on the west's party wall. The new construction building is placed to have a view of the cor-ten steel on the west side. Cor-ten steel rusts and weathers over time, so the residence is meant to have a clear view of this process, like an art gallery.
The owner requires the west side of this building to be constructed out of a single pane of unbroken clear laminated glass, so that the view of the cor-ten steel is not obstructed in any way. In addition, the owner has requested an HVAC system which is near silent and invisible to occupants. It was clear based on the project requirements that a hydronic radiant system was the most obvious way to achieve the silent and invisible requirement, but the west facade envelope load was estimated to be very high in this hot climate, even though it is highly shaded from the neighboring building. Analysis was done to prove that a radiant system could meet the HVAC load while still providing acceptable thermal comfort.
How was simulation integrated into the overall design process?
We built are loads model at the very beginning of design, since it was needed to provide input on if the proposed HVAC design had any chance of keeping the space comfortable. We were unable to suggest any architectural changes that would change the aesthetics of the space, though our modeling resulted in major changes to the structure. The opaque conduction loads were quite high without insulation, so we were able to communicate to the project team that the project goals would not be met without some way of reducing the envelope load.
The structure had to look like a solid concrete block from both the inside and outside, though we were able to get the structural engineer to embed insulation inside the concrete. Once we got this design change from the team, we found through the loads modeling that a radiant system could meet the load if both floor, ceiling, and east wall (the largest by far opaque wall) were embedded with hydronic radiant tubing.
Our work was mostly siloed since our main analysis goal was to estimate if the system would work, and we had very few levers to pull except embedded wall insulation and amount of radiant tubing, but our results had significant effects on the building design at an early stage.


How did you set up the simulation analysis and workflow?
The geometry was built using the SketchUp Openstudio plugin, since this gave us many options for geometry export and use with different tools. The geometry was initially imported into IES VE to perform the peak thermal loads analysis. IES VE is the preferred tool based on industry standards and the high quality visualization of loads simulations. The load results were compared against internal radiant load tools developed at our firm to estimate the radiant feasibility.
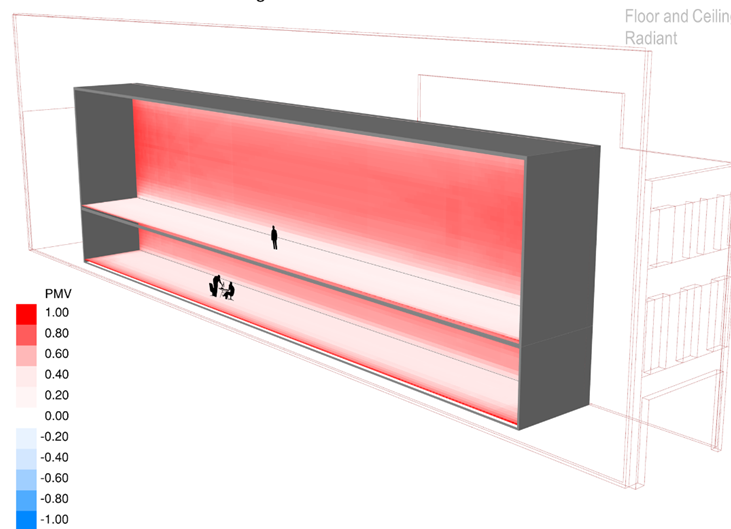
Once we had a path forward showing that radiant could work to meet the HVAC load, we needed to analyze the comfort in the space. Since the west wall is so highly glazed and the floorplate thin, there is a concern regarding radiant temperature of the glass

How did you visualize the results to the design team? What was successful about the graphics that you used to communicate the data?
The results were successful in breaking down the major thermal load components for the project team. This helped the team understand that there was very little that could be done to reduce the load since the glazing on the project was non-negotiable. This conveyed the need to fit as many radiant panels as possible. Additionally the extra insulation is expensive to embed, but our graphs showed that it could make a big enough difference to allow the project to meet it's goals of a silent HVAC system, so it was put into the project. The thermal comfort maps provided additional insight to the team and further illustrated the need to run radiant through the east wall, since comfort was significantly improved with this addition. Overall the graphics were successful because they broke down complex topics into simple images that clearly conveyed how the goals could be met.


Most importantly, what did you learn from the investigation? How did simulation and its outputs influence the design of the project?
The analysis was extremely useful for establishing additional constraints on the project. In a way, the team already had an idea that the there would need to be substantial radiant tubing to meet the load, but the analysis quantified that it was even possible. Without the analysis, the team likely wouldn't have added the expensive insulation to the project. The team may have steered away from using radiant since the assumption may have been that the load was too high, and the project wouldn't have met its goals.
It also taught me that simple images can convey a great meaning regarding complex simulations. The thermal comfort maps in particular do a great job at showing the difference between options for clients, without having to see any numbers.